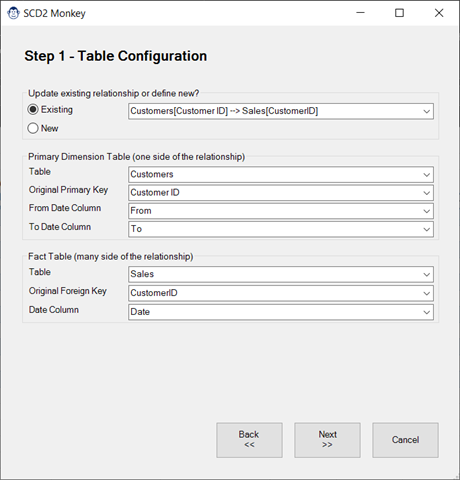
Monkey Tools

Basic Explicit Measures

Article Overview

One of the cool features in Power BI is ‘Quick Measures’, which allow you to quickly build up some DAX measures that might be challenging for a newer user. The one that that has always bothered us, however, is that it doesn’t provide an easy-to-use interface to build those basic explicit measure building blocks. The Basic Explicit Measure Monkey isn’t super complex, but it does help provide a simple interface to build your basic measures without writing any DAX code yourself.

In this article, we’ll explore exactly what this Monkey does, as well as how to use it.

The Basic Explicit Measure Monkey

What this Monkey does

Found on the Measure Monkeys menu, the Basic Explicit Measures monkey allows you to create basic explicit measures in a no-code environment. It even provides smart aggregation choices for you, so that you’ll never be prompted to create a measure to SUM your textual values!

Selecting the Basic Explicit Measure Monkey from the Measure Monkey menu

Creating a Basic Explicit Measure

How it works...

In the image shown here, you can see the general workflow of the the Basic Explicit Measure Monkey.

  1. Choose your Table and Column you wish to aggregate,
  2. Select the aggregation you’d like to create,
  3. Review the DAX formula that the Measure Monkey has created for you,
  4. Change the measure name and table you’d prefer to store it on, and finally
  5. Set your desired default format.

And once you’ve completed all of the above steps, click Create Measure to finish the job. 

Seem too easy?

Honestly? That’s the exact point. Creating your basic aggregations should be this easy. You shouldn’t need to type a formula, just name it, as you can do here.

Where the Basic Explicit Measure Monkey Shines

Working with a simple SUM function is.. well… simple.  But what if you are trying to return a count of something? Did you know that there are seven distinct functions that are used to count things in DAX, and it actually matters which you use?

This is one of the benefits of our Measure Monkey. It knows which count function should be used for which scenario!

As you can see in the image shown here, we chose the Class column of the Categories table as our base column. Our Measure Monkey knows this is a textual column, so removes all aggregation types which target numerical data only (see 1.) It then also provided us with a few descriptive options for different types of counts we may be interested in.

We settled on a Distinct (Unique) count, at which point the Measure Monkey:

  • Creates the correct DAX pattern
  • Provides a default descriptive name
  • Picks a whole number data type

This monkey is all about helping you reduce clicks and typing to build your basic aggregations quickly.

See this feature in action!

Check out Ken’s demo for the KSA Excel meetup on YouTube:

Share:

Facebook
Twitter
LinkedIn

Related Posts

SCD2 Monkey

Coming Soon! Sorry, but this article isn’t quite ready yet. We promise that we’re working on it! In the mean time – until we get

Calendar Monkey

Coming Soon! Sorry, but this article isn’t quite ready yet. We promise that we’re working on it! In the mean time – until we get

Click Query Monkeys -> Measure Table Monkey to add measure table

Add Measure Table

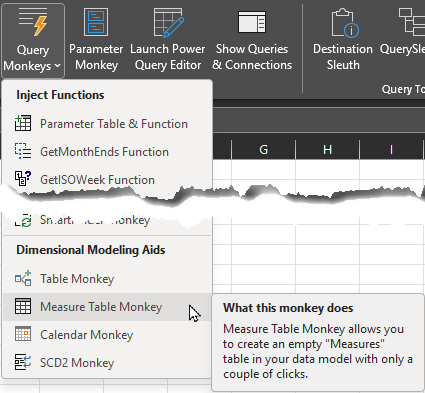
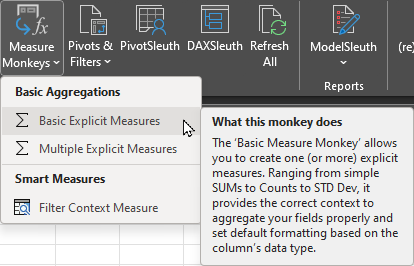
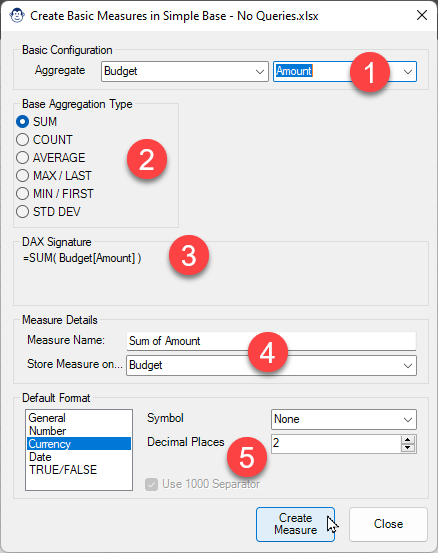
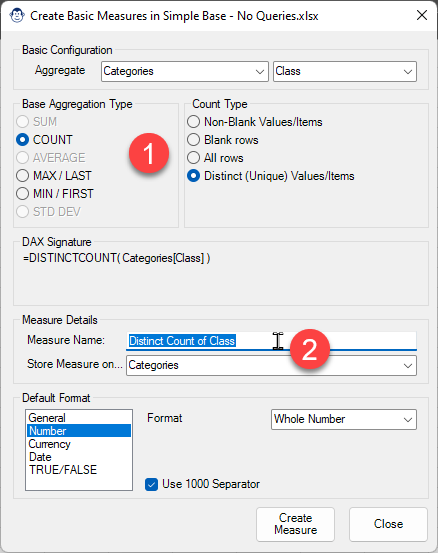
Article Overview Many modelers like to store their measures on a single “Measures” table in the data model.  If you’re one of them, you may

Table Monkey

Coming Soon! Sorry, but this article isn’t quite ready yet. We promise that we’re working on it! In the mean time – until we get

SmartFolder Monkey

Article Overview One of our favourite tricks is to create a “From Folder” solution which avoids hard-coding a file path, instead pulling it dynamically via