
Monkey Tools Features List
The Monkey Tools Excel add-in provides a broad set of new features specifically for working with Power Query and the Data Model, and is divided into two general collections: Monkeys and Sleuths. Simply put, our team of Monkeys make things happen, and the Sleuths figure out what has happened.
Monkey Tools is pretty packed with features… and we’re not done yet. Here’s a quick summary as to what you can expect today:
Jump directly to your feature of interest...

Learn to use Monkey Tools with our FREE course!
Curious how you can unleash our army of monkeys and put them to work for you? Learn for FREE on our Skillwave Training learning platform! Ken Puls demonstrates how the various Monkeys and Sleuths work, so you can get the most from these amazing features.
Our "Monkeys" help you build models faster
General Monkeys
While only one of these Monkeys has a visible button on our Monkey Tools ribbon, you’ll find that each can do some amazing work to make your life easier…
The (Mostly) Invisible Monkeys
These Monkeys update or replace Excel’s default behavior to do things that we wish the Excel team had put in place by default. Overall, their goals is to make your work easier overall and/or set you up for easier maintenance in future.
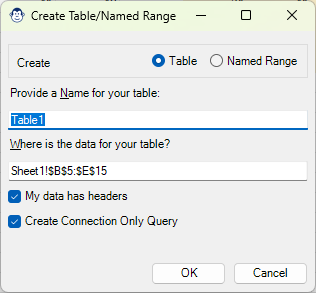
One of the things we have been asking the Excel team to do for a long time is give us the ability to provide a table name during the creation process. This is particularly important when using the Get Data From Table/Range feature, as this feature creates a generic table (or dynamic array) name and references it via Power Query. When you then update the name, your Power Query blows up and needs to be fixed.
To solve this issue, Monkey Tools replaces the standard “Create Table” dialog with a custom “From Table or Range Monkey” dialog which gives you not only the ability to name your table, but a few other options as well.
Learn more in our From Table or Range Monkey KB article.
If you’ve ever had a Power Query that consumes an Excel table, then renamed the table you’ll know what happens: Your Power Query blows up, and you have to manually edit it to get the table name back in sync inside the query. The Table Rename Monkey solves that issue for you, watching for this exact issue. Simply put, you rename an Excel table, and the Table Rename Monkey will look through all of your Power Queries and update them so that you don’t have to!
This is – by far – the shyest of our Monkeys. You’ll never see him in the wilds, and he only ever works for users on a Pro license. But when he does work – wow!
The Biblio Monkey
The Biblio Monkey is your own personal librarian who not only looks after important Formula, Power Query and DAX Measure patterns (among other types), but also allows you to tag them for contextual replacements when inserting them into new workbooks. If you’ve been in the habit of storing key items in workbooks, or notepad files, you’ll love having the Biblio Monkey at your disposal, bringing your key items to where you are actually working!
The Biblio Monkey is familiar with all of the following Excel object types:
- Power Queries
- DAX Measures
- Excel Formulas
- LAMBDA
- Python
- VBA
- Office Scripts
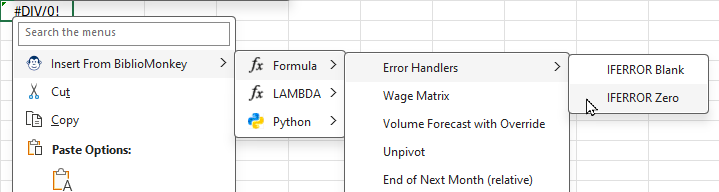
For regular, LAMBDA or Python formulas, this is super easy – just right click a cell and choose which formula to insert. You’ll be prompted to update any tags you’ve inserted, and then the formulas will be injected into he selected cells.
If you happen to have a pro license, injecting Power Queries and Measures can be done via the same route. If not, you’ll just need to open the Biblio Monkey, select the desired item and choose Copy, then paste it in the appropriate place.
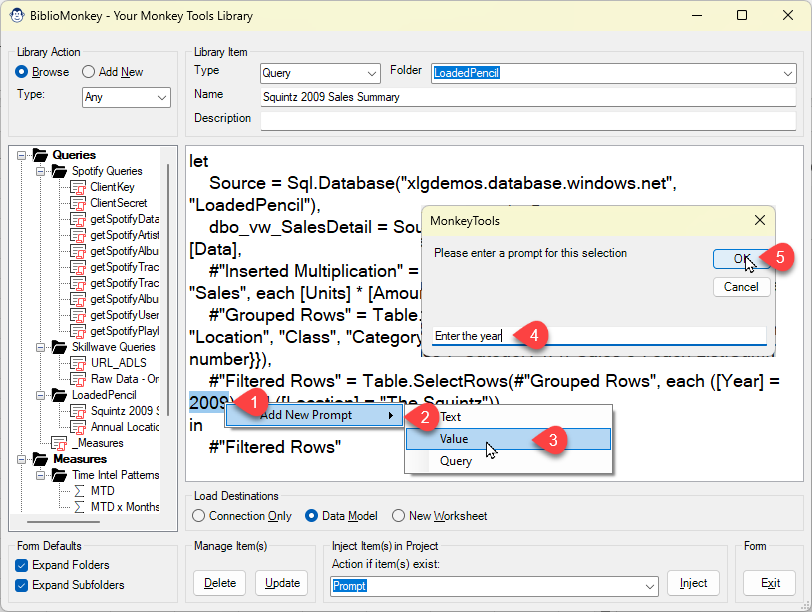
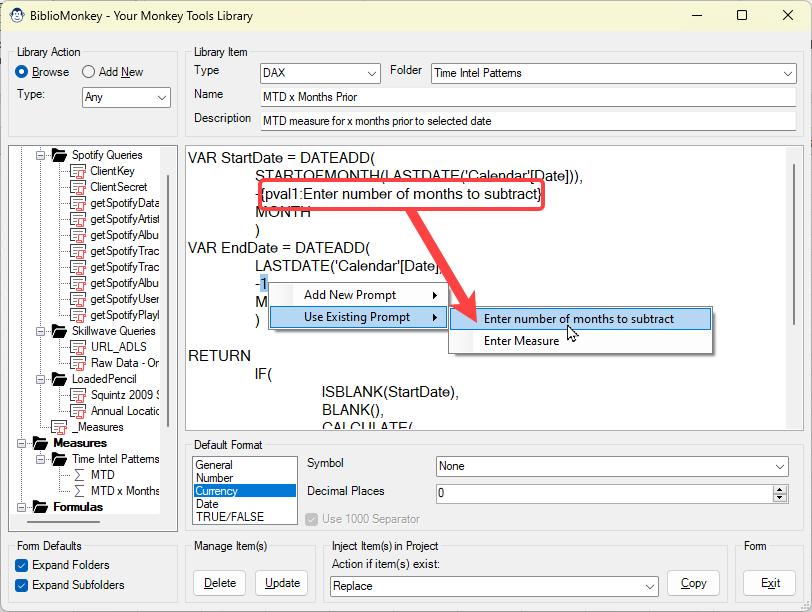
When you create a new item in the Biblio Monkey, you can select portions of the text, right click them, and choose from a list of contextual tags. You also get to define the prompt you’d like to see.
When you then inject/copy the item in future, the Biblio Monkey will pop up a form asking you to replace these tags with the appropriate items.
This depends completely on the text of item you are storing in the Biblio Monkey. All items support text and value prompts. Other objects have context specific tags you can declare. For example:
- Formulas: ‘Current cell contents’, a variety of Relative vs Absolute references, fully qualified (worksheet!) references
- Power Queries: Query names
- DAX measures: Measures, Tables, Columns, Qualified Columns, and much more.
For a full list, check out the Biblio Monkey KB article.
Query Monkeys
These Monkeys hang out on the ‘Query Monkeys’ menu in Monkey Tools and are adept at inserting key queries into your workbooks. While some are very easy for the Monkeys to take care of, you’ll find that others are more complex. In those cases, they’ll ask you to choose your preferred options and configurations, presenting you with easy to use wizards to do so. Select your choices, click OK and the Query Monkeys will take care of the rest! Learn more about our individual Query Monkeys below:
Inject Functions
This area currently contains five different types of functions that can be injected into your workbook. Expand each of the sections below to learn more about what they do:
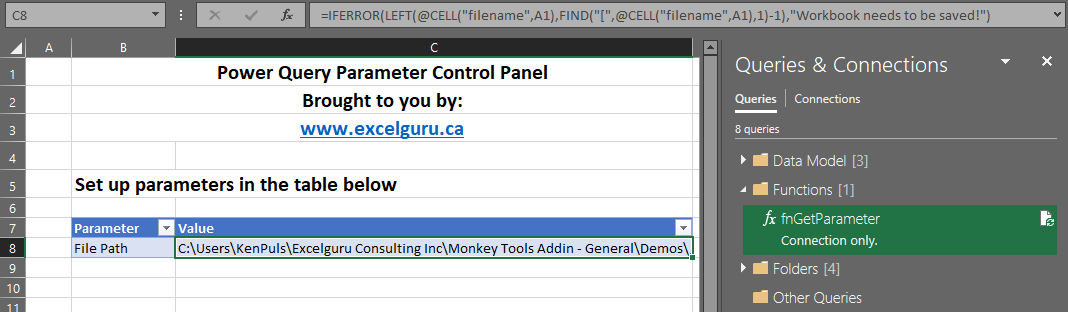
If you’re a fan of the fnGetParameter function (as per Chapter 17 of my Master Your Data book), you’ll love this Monkey. With just a click, it will insert the Parameter Table and fnGetParameter function into your workbook. It even places the Excel File Path formula in the cell for you!
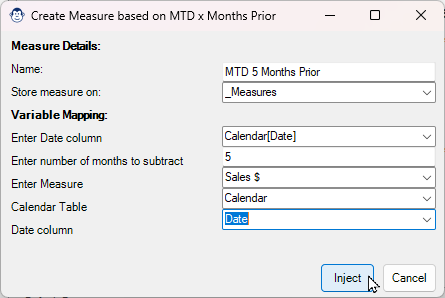
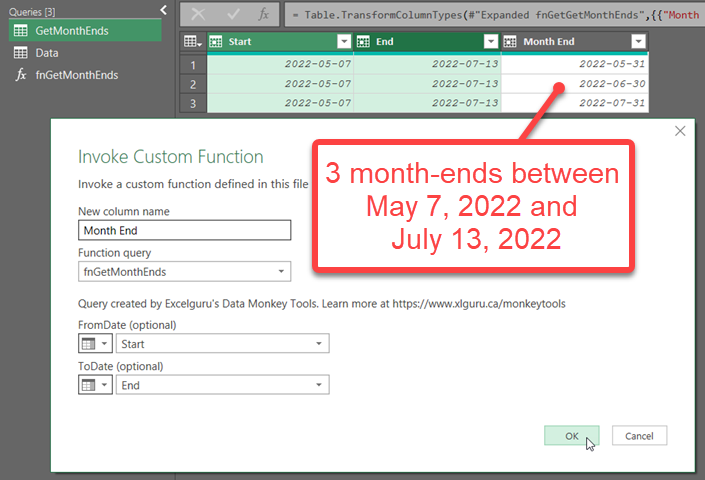
This handy little function allows you to pass in two dates, and return a single-column table of all Month-End dates between the provided dates. It’s nice and simple, and saves you from having to write the function yourself.
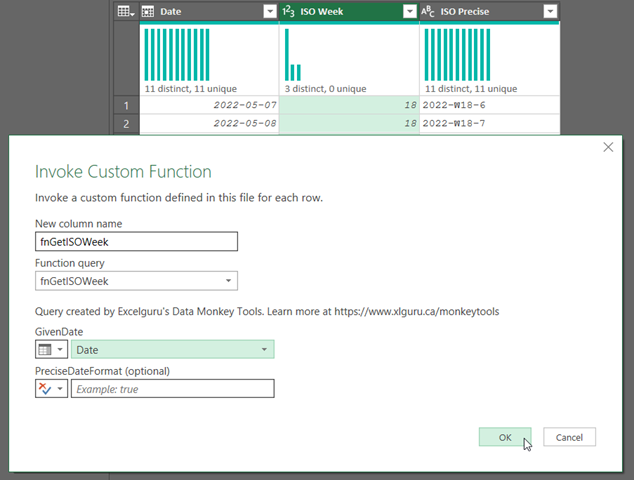
We heard from some of our European friends that they are not fans of the North American week numbering systems. This function allows you to pass in two data points: a date and an optional “precise” choice. These return a properly formatted week number based on the ISO 8601 standard. If you elect to go with the “precise” version it returns the date in the format “2022-W15-1”.
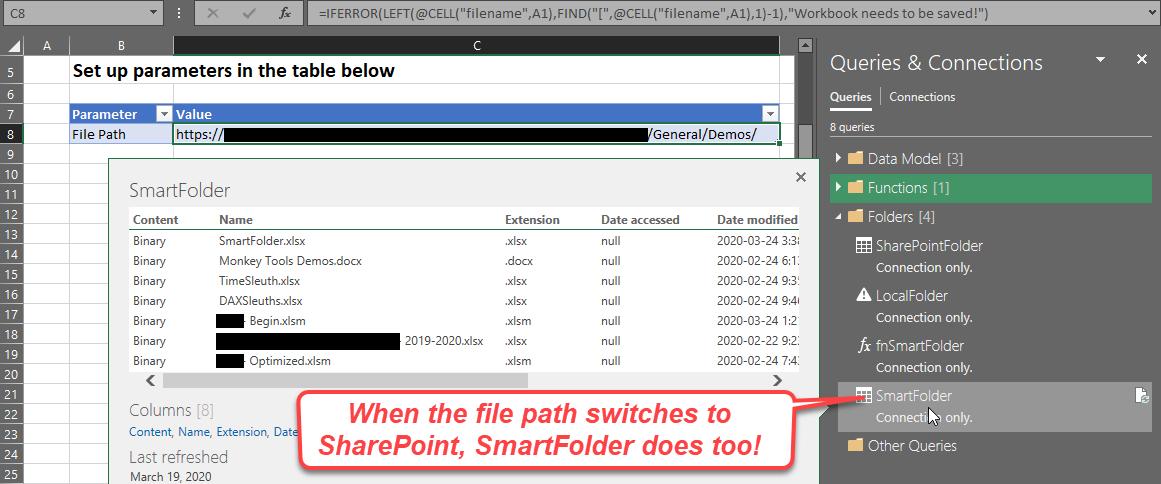
If you save your files into folders that sync to OneDrive for Business or SharePoint, you’ll know the pain that happens if you try to reference a file based on the path returned by the CELL() function… This function provides the answer to that problem, as you can pass it either a local path on your hard drive or the web path and it will “smart switch” to use the correct Power Query connector to read from the local or SharePoint hosetd file. It complements the fnGetParmeter function extremely well.
If you save your files into folders that sync to OneDrive for Business or SharePoint, you’ll know the pain that happens if you try to reference a folder based on the path returned by the CELL() function… This function provides the answer to that problem, as you can pass it either a local path on your hard drive or the web path and it will “smart switch” to use the correct Power Query connector to read from the local or SharePoint folder. It complements the fnGetParmeter function extremely well.
Inject Queries
In this section, we have three Monkeys that we can put to work:
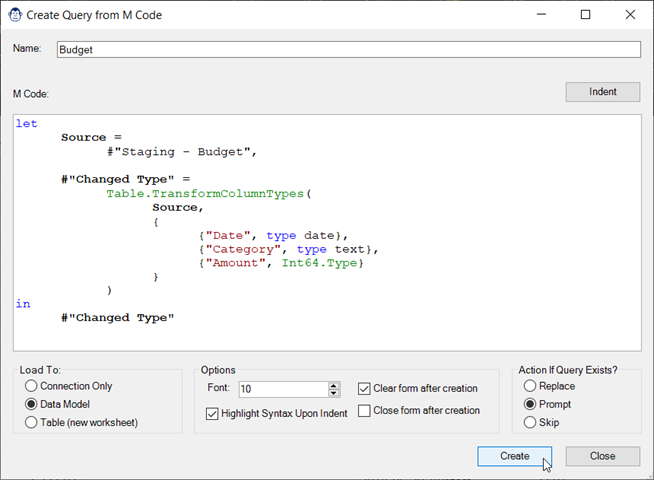
Maybe you have a collection of Queries stored in a text file, or you participate in help forums and need to copy and paste someone else’s M code to work through a sample… don’t you find the current experience of opening Power Query, then the Advanced Editor, then pasting, closing, renaming and finally choosing the load destination a bit tedious? Why not just launch the “Forever Free” Monkey that allows you to create and configure a Query from M Code? Do it all in one screen without ever leaving the Excel interface!
Oh, and did we mention – you can even indent your code in this interface, to make it easier to read?
What’s so special about the SmartFile Monkey? It injects a Parameter Table, the fnGetParameter Function and the SmartFile Function in one go AND links them all together. Sure, you could just use the free features, but wouldn’t it just be easier to let the SmartFile Monkey do it ALL for you?
NOTE: The SmartFile Monkey requires a Pro license.
What’s so special about the SmartFolder Monkey? It injects a Parameter Table, the fnGetParameter Function and the SmartFolder Function in one go AND links them all together. Sure, you could just use the free features, but wouldn’t it just be easier to let the SmartFolder Monkey do it ALL for you?
NOTE: The SmartFolder Monkey requires a Pro license.
Dimensional Modeling Aids
The Monkeys in this section are intended to speed up your development of high quality data models in Excel. They follow the patterns we teach in our Dimensional Modeling course at Skillwave.Training, and will let you rapidly build complex logic into your models.
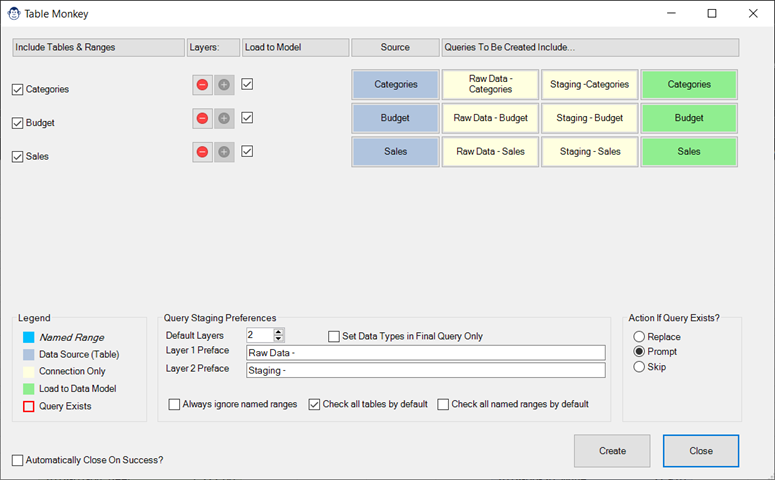
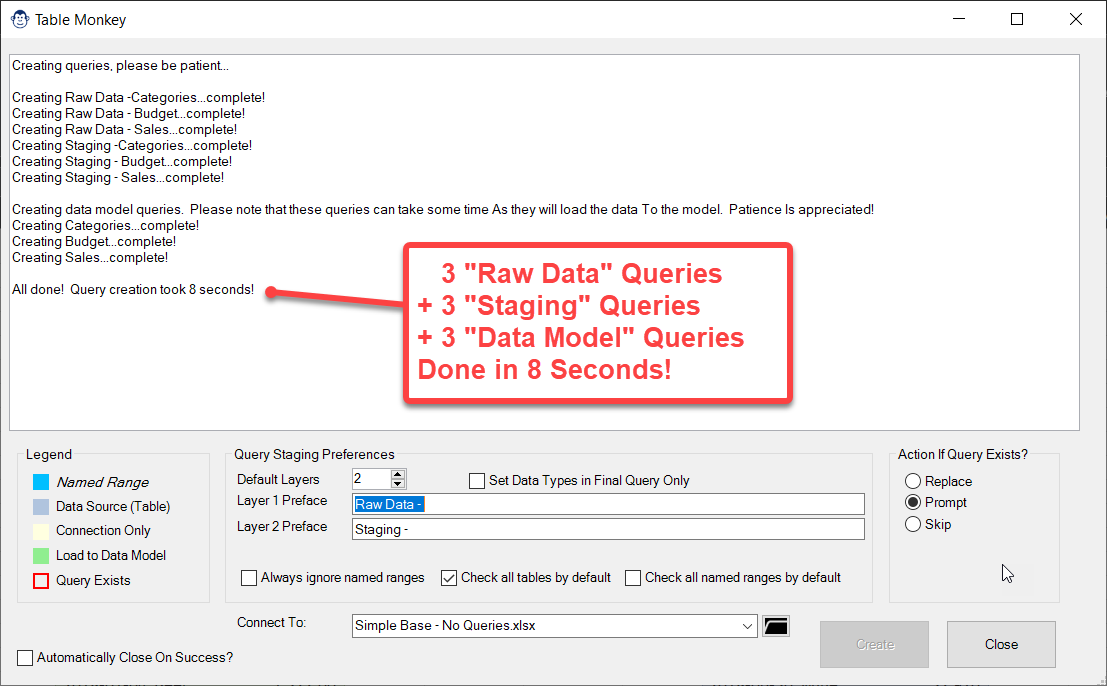
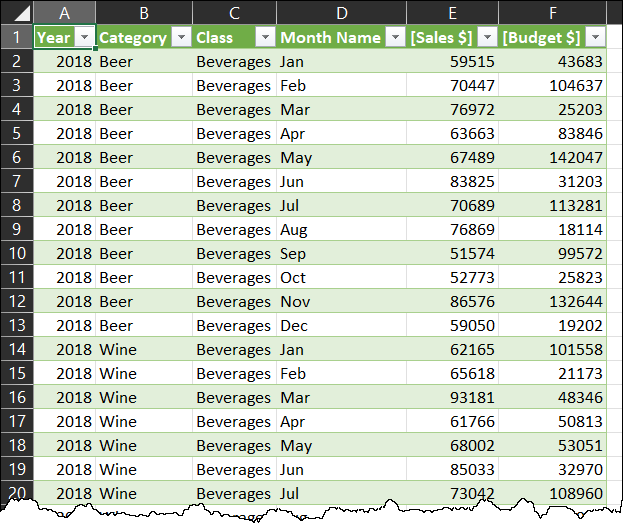
Table Monkey allows you to quickly create connections to multiple tables and named ranges in a single workbook, and load them to the Power Pivot Data Model. This monkey allows creating up to two layers of staging queries, choosing which ranges or tables to load, renaming your Excel tables on the fly and more. There is simply no faster way to load multiple queries to the Data Model!
Are you a fan of creating a separate (disconnected) table to hold your measures? Then why not ask the Measure Table Monkey to do it? All you need to do is provide a name, click OK and then hide a column. (Our Monkey is a bit frustrated that it can’t do that last part for you, but it is a limitation with Excel’s object model.) Regardless, it is still much faster than opening Power Query to do this yourself!
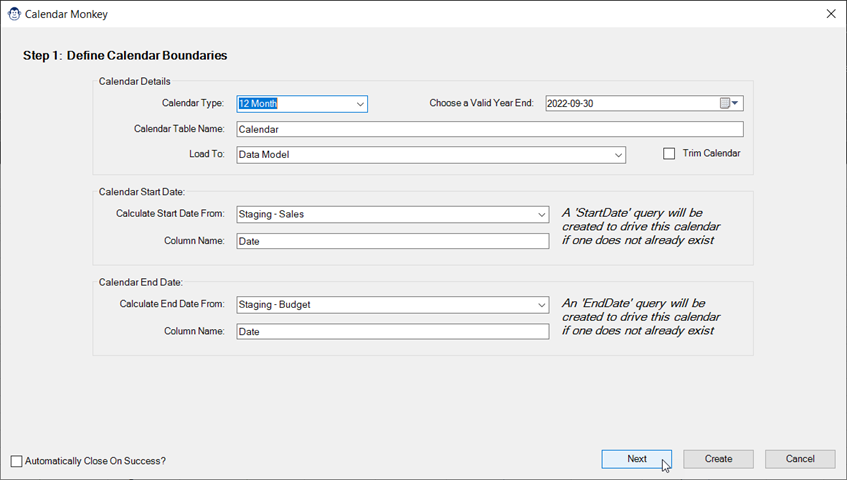
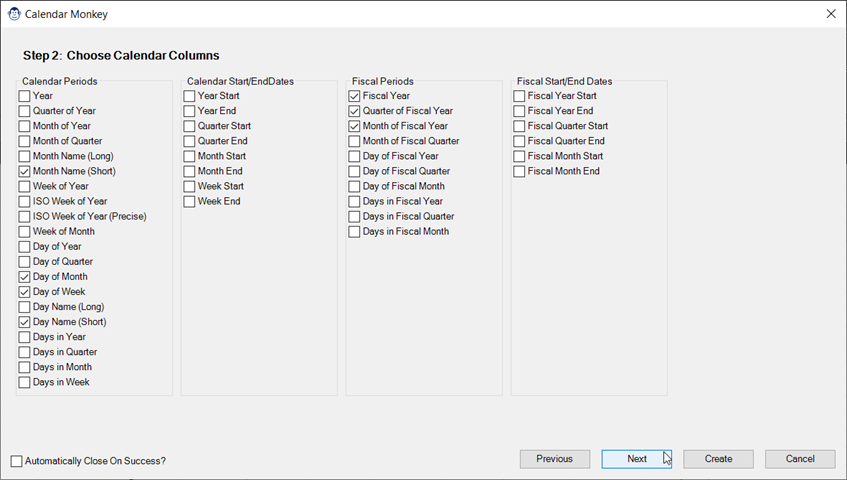
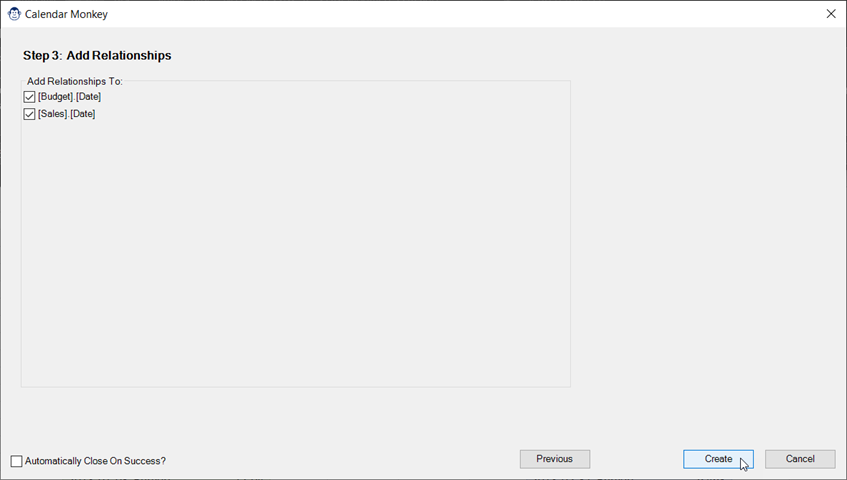
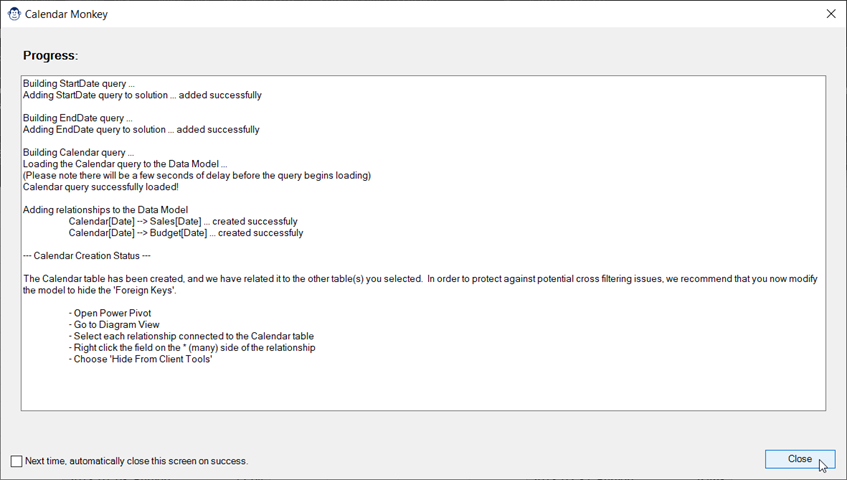
One of our most capable primates, the Calendar Monkey walks you through the entire process of configurating a customized calendar that dynamically expands to cover the data range in your model. You have complete control over all of the following:
- Calendar type (12 month, 13 periods or 445 variants)
- Year-end date
- Columns to drive the start and end dates
- Date columns to create
- Tables you’d like to relate your calendar to
Follow the easy-to-use wizard to configure it all, then let Calendar Monkey do the hard work for you. Building your dynamic calendar could not be any easier!
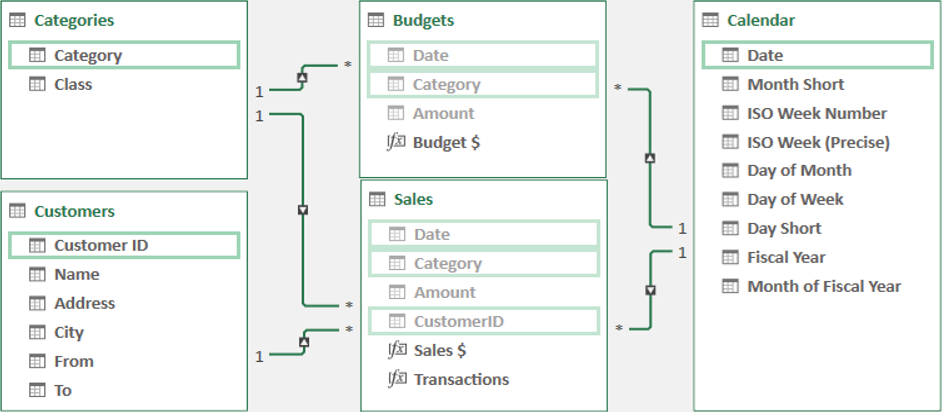
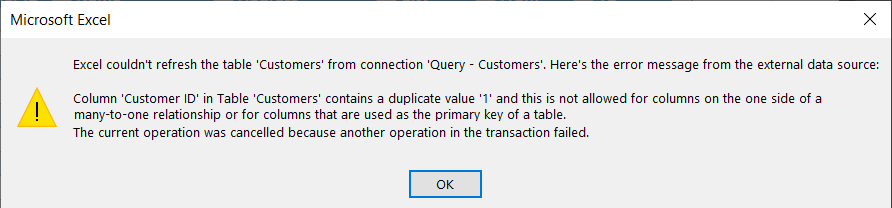
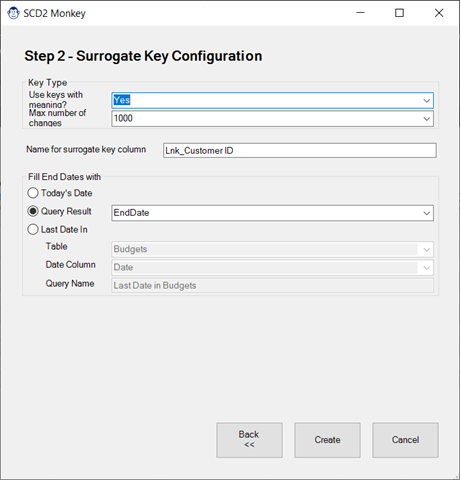
Have you ever run into a scenario where you’ve built your data model, but then a duplicate value shows up in the primary key of your dimension table? Maybe a customer moves, resulting in two separate addresses for the same customer, or you get a new price for a product. Regardless of what happens, you determine that you need to keep both records, but that obviously isn’t going to work. So what do you do?
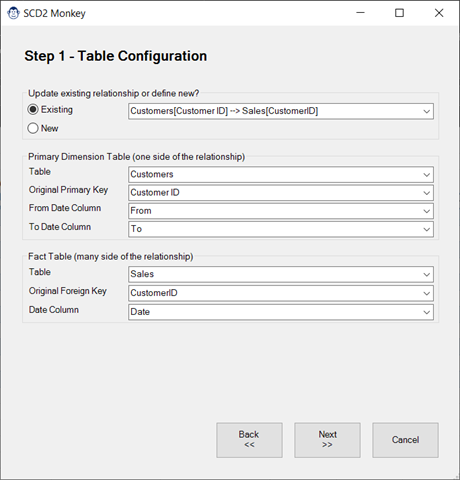
The answer is often to create a Type 2 Slowly Changing Dimension. (If this is a new term to you, you should really consider our Dimensional Modeling course, as we teach you about the issue, as well as how to solve the problem.)
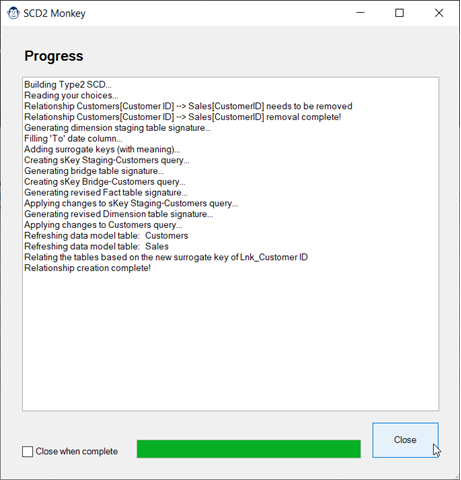
Even when you know HOW to solve the problem, it takes a significant amount of time to do so, as you need to create the correct queries to adjust your model without breaking things. And that is where the SCD2 Monkey comes in. Using its guided wizards, it will walk you through the key configuration needed, then run off and do the work for you. At the end of the day, all that will be left for you to do is hide the new surrogate key columns, refresh the data table and smile!
Ready to put our Monkeys to work?
Measure Monkeys
Basic Aggregation Monkeys
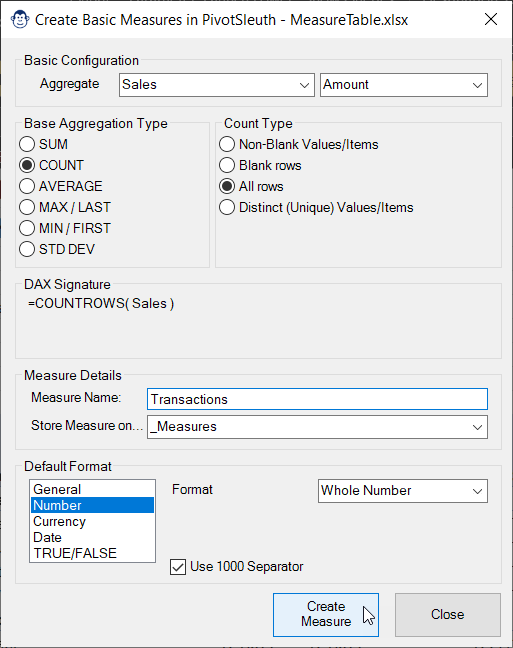
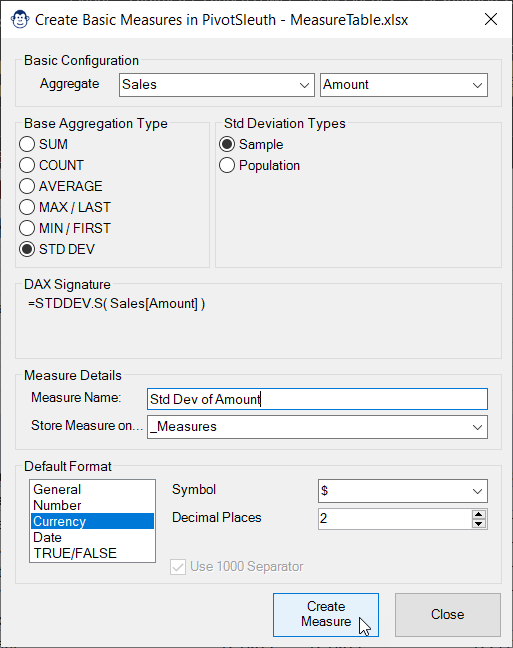
Power BI has a great feature called ‘Quick Measures’. But while it makes it very easy to create more complex measures, it simply doesn’t bother with basic aggregations that form the building bricks of a well designed model. These Monkeys aim to make life easier for you, whether you need a single measure, but don’t know the exact syntax, or need to create multiple simple aggregations with speed.
The Basic Measure Monkey is just that… it handles simple aggregations. It is targeted at those who are new to DAX and need help with getting the syntax correct.
The benefit of this Monkey is that it lets you use a wizard-like approach to building your measure, providing you with aggregations that are valid for your column’s data types. It even shows you the DAX it has written and lets you set your default measure formats.
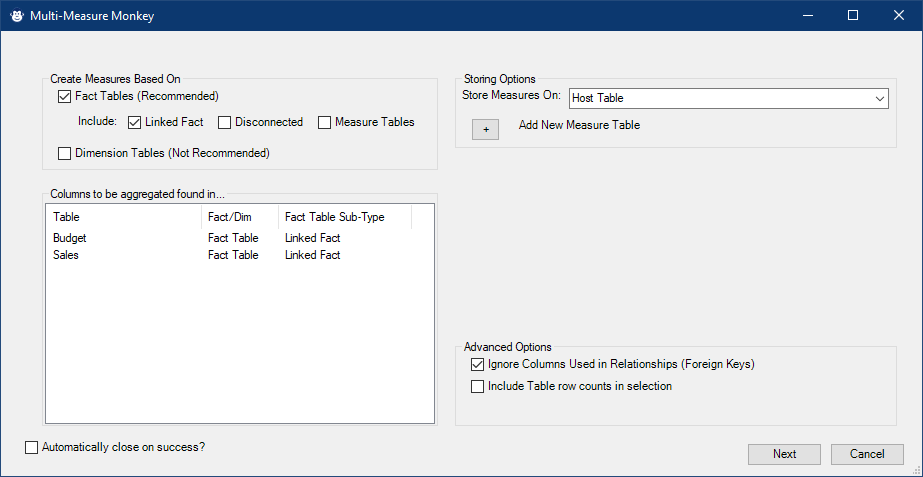
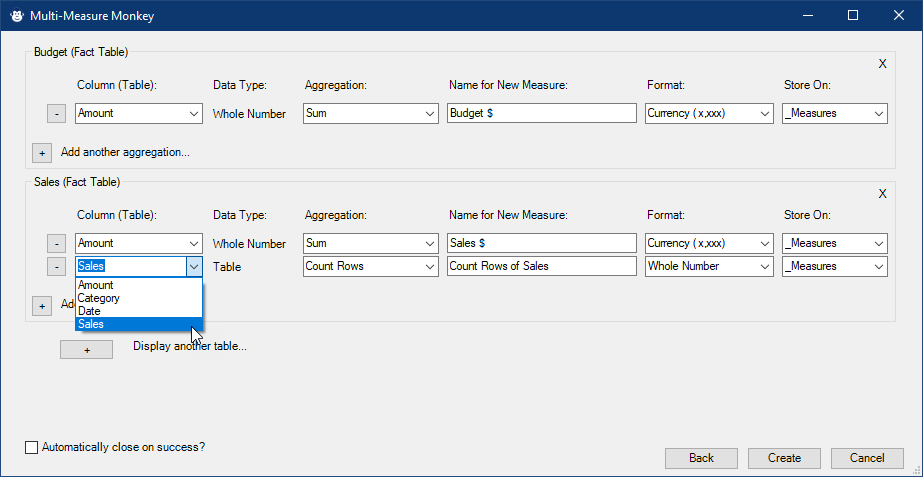
This Monkey is all about getting things done quickly. One of the first steps we do after setting up our data model is to create basic explicit aggregations for all the columns in our Fact tables which then act as the building block for more complex measures. If you’ve done this, you know that it is a tedious process that involves a lot of waiting for Power Pivot to store the measure signatures.
The Multi-Measure Monkey allows you to choose which tables need aggregations, then provides you with a page which contains a basic aggregation for each column. It even provides smart data type defaults specific to each column, and warns you of any name conflicts. Remove the few you don’t want, customize the ones you do, and quickly add any that you feel are missing. You won’t believe how easy it is.


Smart Measure Monkeys

Our collection of Smart Measure Monkeys is limited right now, but don’t worry… we are working on training some new ones!
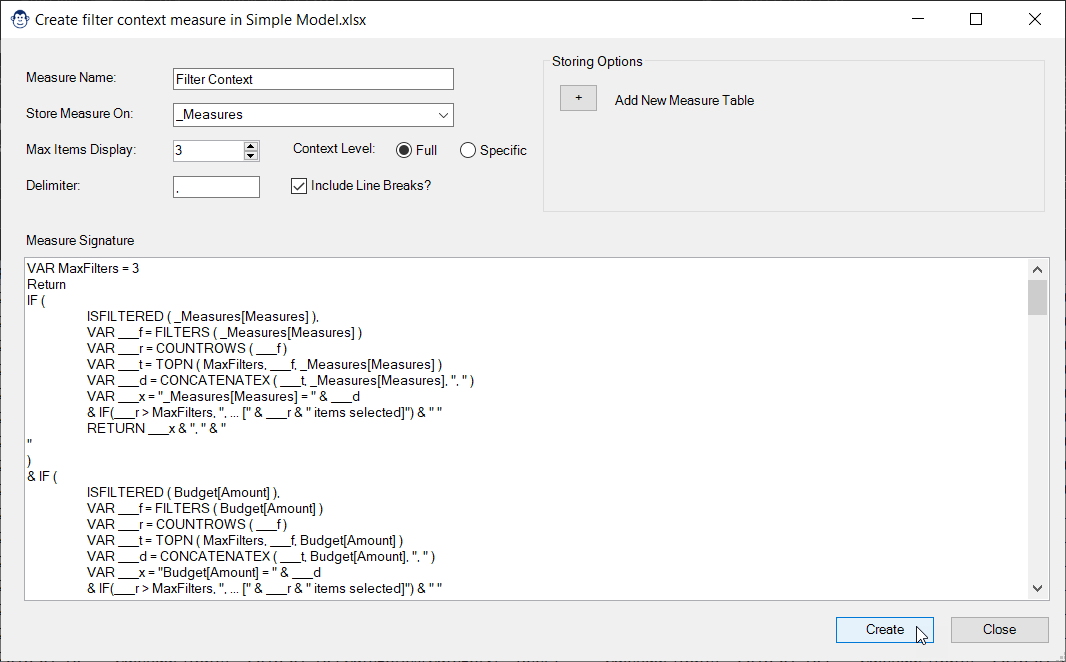
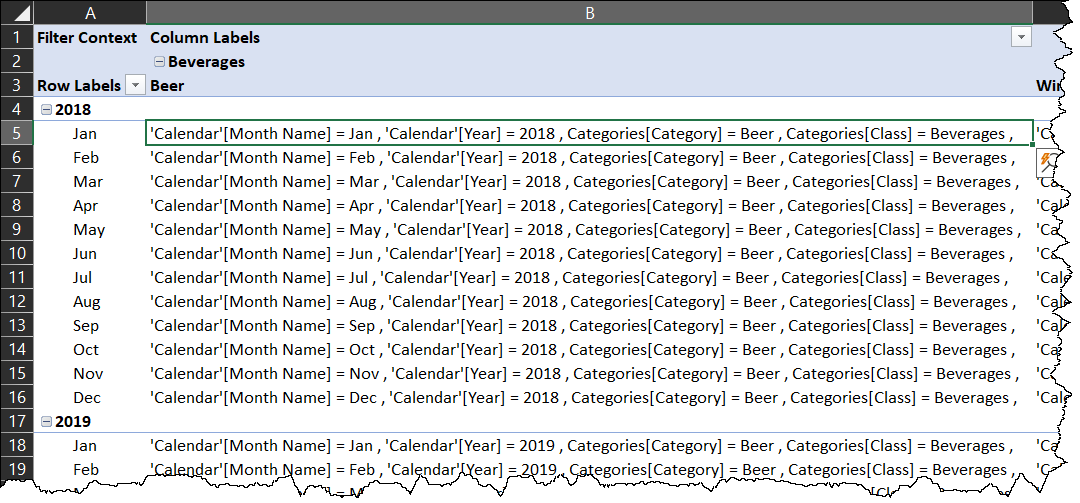
If you’ve ever been stuck trying to work out the exact filter context for a PivotTable cell, this Monkey will be helpful to you. It can build both “full” filter context measures, as well as custom filter context measures for specific cases. You have full control of the maximum amount of values to return, and more.
The Pivots and Filters Menu
This menu is mainly a convenient place to collect the entry points to build Pivots and add filters like Slicers and Timelines. But hiding within this menu you’ll find an important Monkey who might make your life a little easier.
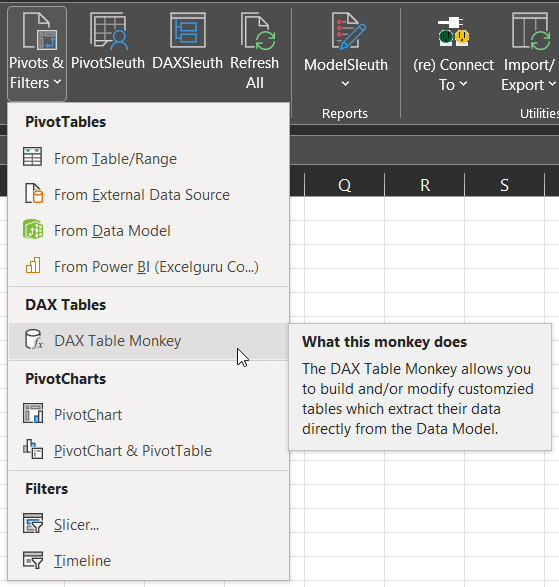
This section of the menu groups all of Microsoft’s standard PivotTable insertion points into one logical section. You’ll find:
- The classic From Table/Range button
- The classic From External Data Source option
- From Data Model
- From Power BI
Each of these provides the default behaviour from Microsoft and are only grouped here for convenience.
Note for Excel 2019 and earlier users: If this menu doesn’t contain all of these options, you may want to go to the Options Monkey -> Global Options and turn on the option to “Use Legacy PivotTable Menu Buttons”
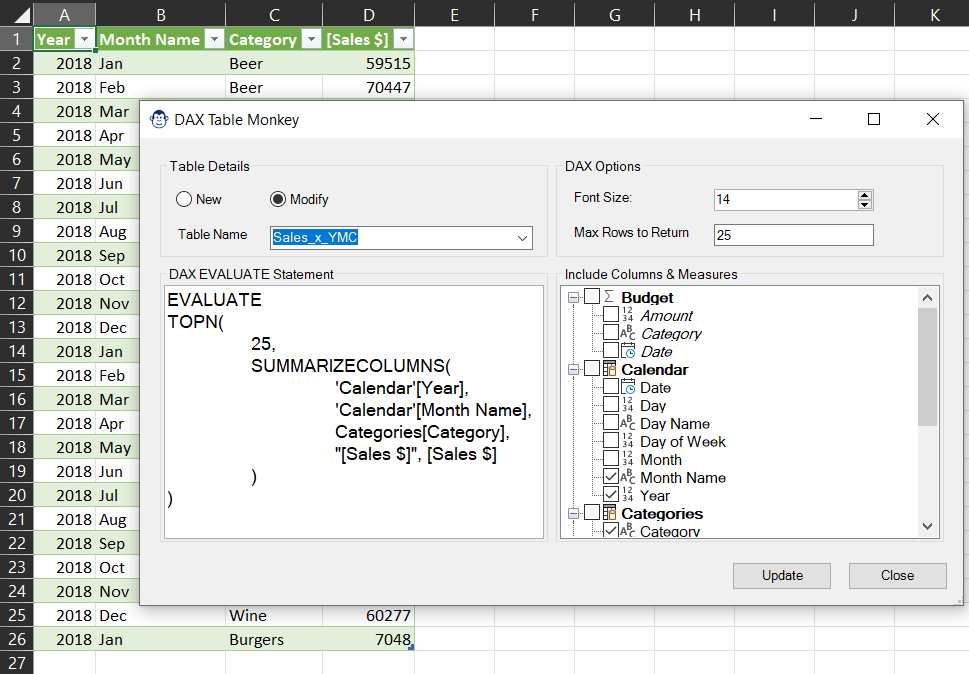
When reporting your data, there are times when you just want to return results to a table, not a PivotTable. While this is completely possible, it involves creating a table and modifying its properties – and that is before you get to try getting the DAX syntax correct. So why not let the DAX Table Monkey help?
This simple wizard allows you to choose your desired tables, columns and measures, set the number of rows to return and writes the DAX for you. Just click Create to have the DAX table added to your workbook, and marvel as it updates every time the Data Model is refreshed.
Make a mistake? Not an issue… just launch the DAX Table Monkey again, and you’ll be able to modify all of the DAX tables in the workbook.
Note: This tool can also build a DAX Table against a Data Model in the Power BI Service if you’ve already connected to it via Analyze in Excel or Data -> Get Data -> Power Platform -> From Power BI.
The PivotCharts section is another convenience collection, providing the entry points to create a new PivotChart or PivotChart with PivotTable.
We find it very common to create Slicers and Timelines immediately after adding a PivotTable. By having them here, we end up spending less time switching Ribbon tabs.
The Modern Pivot Monkey’s goal is to help you quickly take a classic PivotTable and create an upgraded Data Model-backed PivotTable, opening the abilities to:
Leverage the power of DAX measures.
Perform source data filtering and cleansing via Power Query.
Expand the data model’s logic, enhancing the analytic output.
Learn more in our Modern Pivot Monkey KB article.

and build measures (and your Data Model) faster!
Model Monkeys
Underneath the covers, Monkey Tools has a custom-built “BI” Model which links all of your Power Queries with the Data Model components and more.
Connection Monkeys
It’s the job of our Connection Monkeys to analyze your file, and populate our BI Model with all the pieces needed for Monkey Tools to do its job. These Monkeys have been trained to connect to each of the following data sources…
If you launch any Monkey Tools feature without explicitly choosing a data source, the Connection Monkey responsible for reading from the Active Workbook will jump on the job. But you’ll also find that Monkey is happy to analyze any other open workbook as well.
Power BI models are similar, and yet slightly different than Excel-based models. But that is exactly why we have a special Connection Monkey to focus specifically on Power BI Desktop files. It will ask you to locate the correct .pbix file, and then take care of the rest.
Monkey Tools also has a Connection Monkey who specializes in reading the backup files that our Export Monkey creates. While the Export Monkey only exports the Power Queries and Data Model structure (not the raw data), this Connection Monkey can read it so that you can run (almost) any of our Sleuths against the backup file!


Import/Export Model Monkeys


It is no secret that we love modeling in Excel, but we also realize that sometimes you need to export key parts of your model (Power Queries, Measures, or even Data.) And on other occasions, you need to recreate a model from an external file. In either case, we have you covered.
We are super proud of this primate…
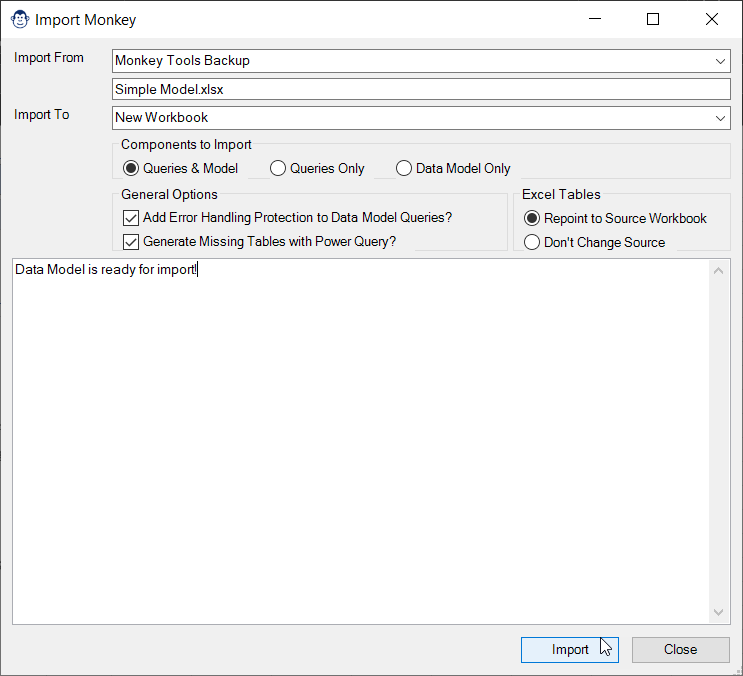
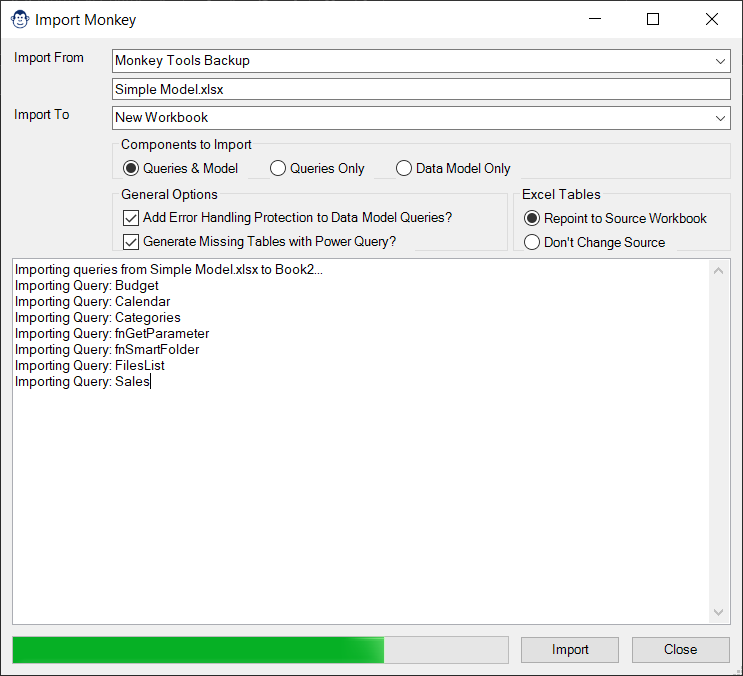
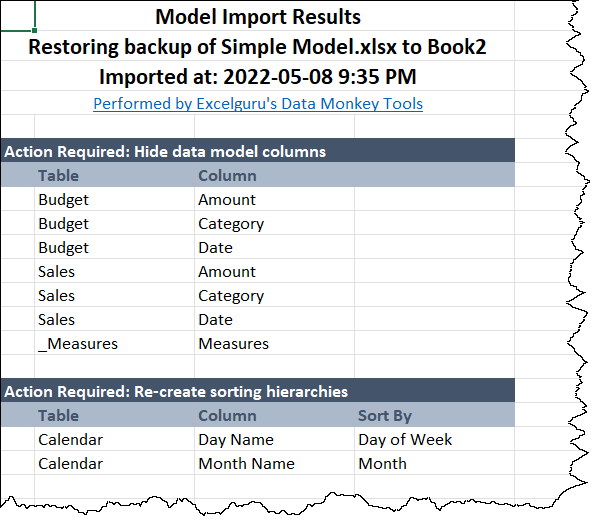
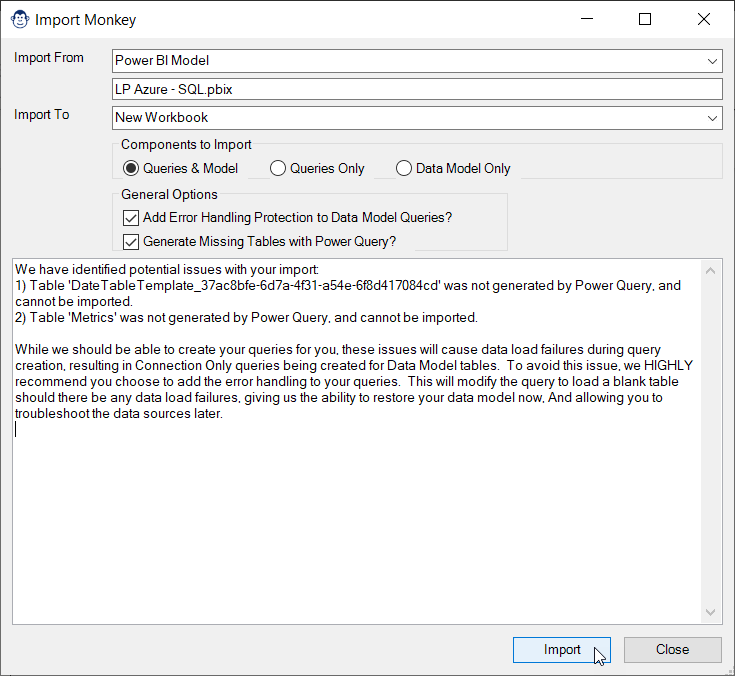
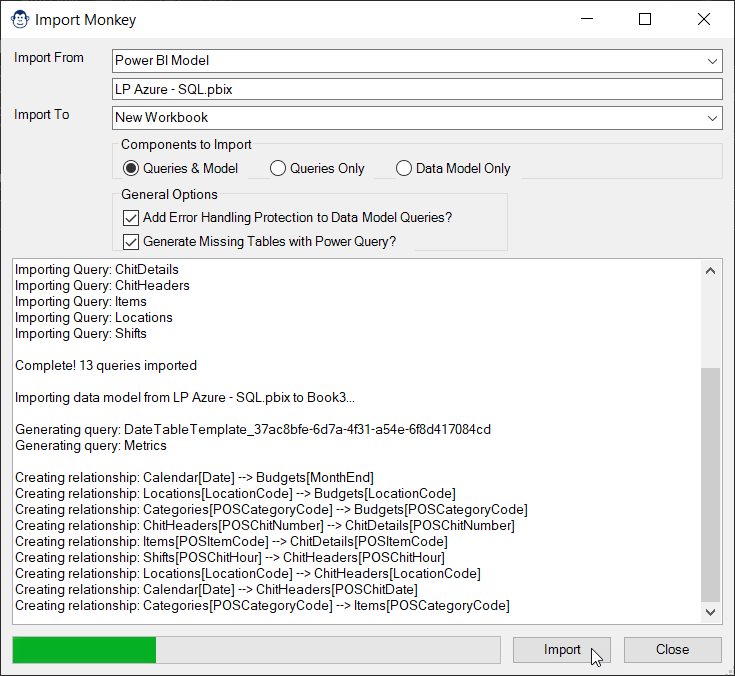
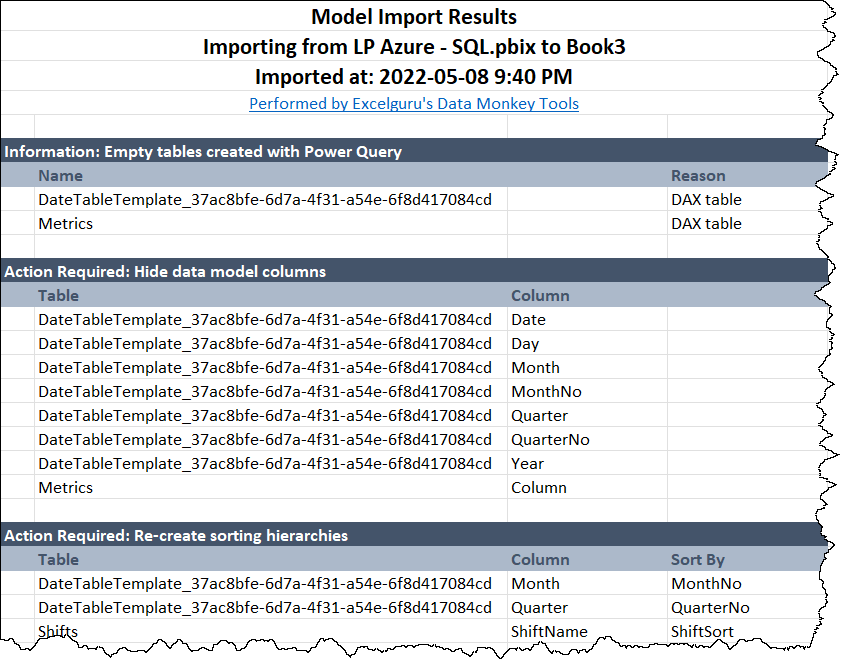
The Import Monkey can read from Workbooks, Monkey Tools Backups and even Power BI Models. It will advise you if it foresees any problems with recreating the model in Excel, offer to wrap your queries in error handling, and then set to work recreating the target file in Excel. Once finished, it will then provide you with a report of any things it had to add, what could not be recreated, and what you need to take care of yourself. (Which generally isn’t much.)
And yes, you read that correctly. The Monkey Tools Import Monkey is the only tool on the market which can import data models from Power BI into Excel!
Now, to be fair, not all Power BI features are supported, but Monkey Tools will do as much as it can and tell you what it could not bring over.
This Monkey allows you to extract the following from your connected model:
- Extract the M code for each Power Query into a separate worksheet in a new Workbook
- Export Power Queries only or a full model structure (Queries, Tables, Relationships and Measures) to a Monkey Tools backup file
The latter only ever exports the structures of the objects, and never exports the data that has been returned by the queries.
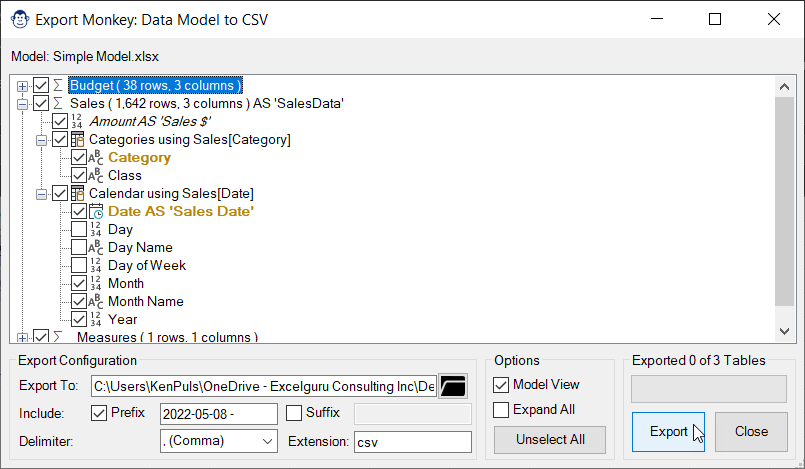
Unfortunately, there is no option to load the results of a Power Query directly into a CSV file, but this Monkey may be the next best thing. Just load your data to the Data Model, and the Export Monkey will put it into CSV files for you.
Within this interface, you can right-click any table to rename the output files. Right-clicking a column will allow you to provide an alias for the column which will be used for the headers inside the file (instead of the original table column name.)
While a Free license will only let you export complete tables, a Pro license gives you much more flexibility, allowing you to choose columns from related tables, add file prefaces and suffixes, and even change the output file format.
Would you like to see it in action? Check out the May 2022 What’s New in Monkey Tools video on YouTube.
Our "Sleuths" investigate your models
The Monkey Tools 'Sleuths'
The Sleuths can be found across the main Monkey Tools ribbon. Their jobs are generally not to make modifications to your queries or data models, (although some let you do so,) but rather to analyze and audit them. From query load destinations to query and DAX dependency tracing to documentation, the Monkey Tools Sleuths are bound to give you a greater understanding of what is happening in your file.
Destination Sleuth
If you’ve worked with Power Query in Excel, you’ll know that you can load queries to an Excel table, to the Power Pivot data model, to both the data model and a table, or as “Connection Only”. The challenge is that when you mouse over the preview pane, you’re either told that the query loads to Connection Only, or as “x Rows Loaded”. But it doesn’t tell you WHERE they’ve been loaded. Well guess what? DestinationSleuth knows!
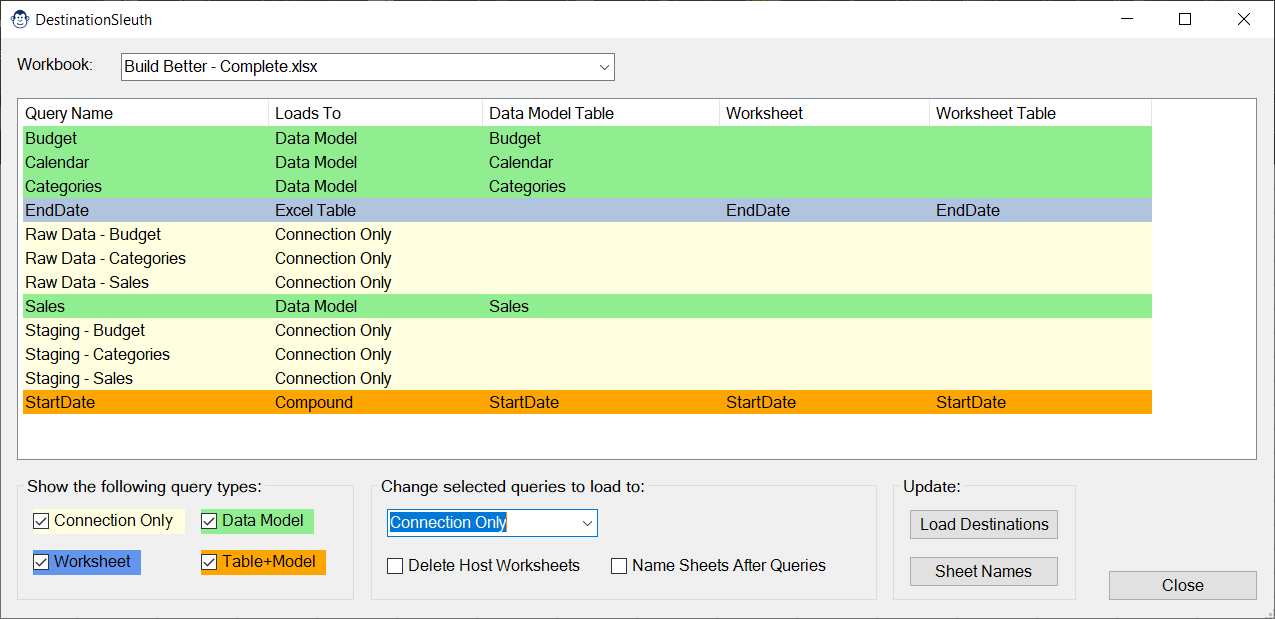
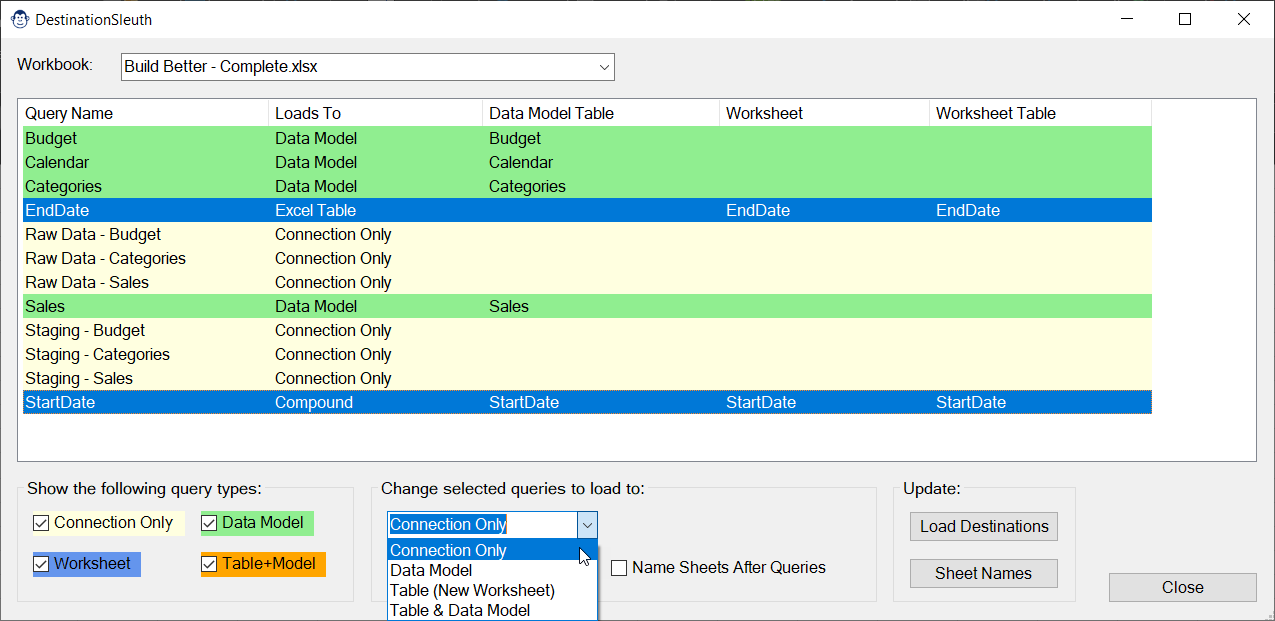
When opening the Destination Sleuth, you’ll be greeted with a listing of all queries in your workbook which clearly lays out the load destination (connection only, worksheet, Data Model or hybrid.)
There is no more guessing which sheet holds your query results, either… for any query that loads to a worksheet table, (including hybrid queries that also load to the Data Model,) this Sleuth will tell you not only the worksheet the table lives on, it also lists the exact table name.
When building a collection of queries in the Power Query editor, you are only permitted to choose one load destination per session, no matter how many new queries you created. In order to maximize speed, we always set our queries to load as Connection Only by default, and then change the load destination of each query that needs to be loaded to a worksheet or the Data Model.
Now this workflow works well enough, but if you have five out of ten queries that need their load destinations updated, you have to do each one individually, waiting for the data to load each time. Not so with Destination Sleuth! Select multiple queries, change the load destination, click Update Load Destinations and go grab a coffee while our Sleuth does this tedious job for you.
If you create a lot of queries, or receive a workbook that already has a ton of queries in it, you may be looking for a way to quickly filter to show only queries of a specific type. Destination Sleuth does this easily via a series of checkboxes in the bottom left of its form.
By default, Excel will create a new worksheet for each query you create. This can lead to a lot of blank leftover worksheet that need to be removed if you change a bunch of your query load destinations to Connection Only.
In addition to allowing you to quickly change multiple query load destinations at once, the Destination Sleuth will also allow you – when changing one or more queries to Connection Only – to automatically remove the worksheet that Excel created.
Today, when creating a new query, Excel names the worksheet based upon the query name. But that wasn’t always the case.
While this functionality is less important than it used to be, you may still encounter older files and want to quickly change the worksheet names to match the query names and this Sleuth will let you do it.
Query Sleuth
The QuerySleuth is a must have for every Power Query user. Developed based on a real business need, we believe this form will add magic to your ability to trace query dependencies and precedents… and it does it all without locking your Excel user interface!
While the Power Query software does have a Query Dependencies viewer on the View tab, the problem is that it only works for very small query dependency chains. With more than a dozen queries, this viewer starts to draw lines over each other, and it is impossible to trace precedents or dependents.
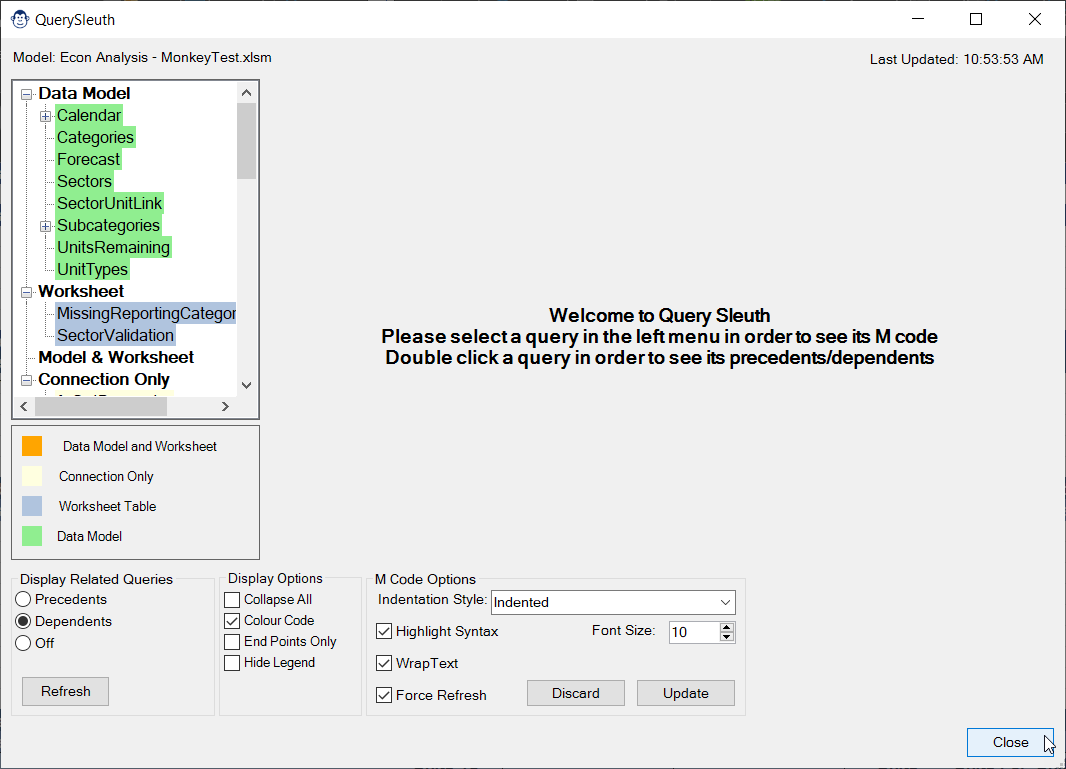
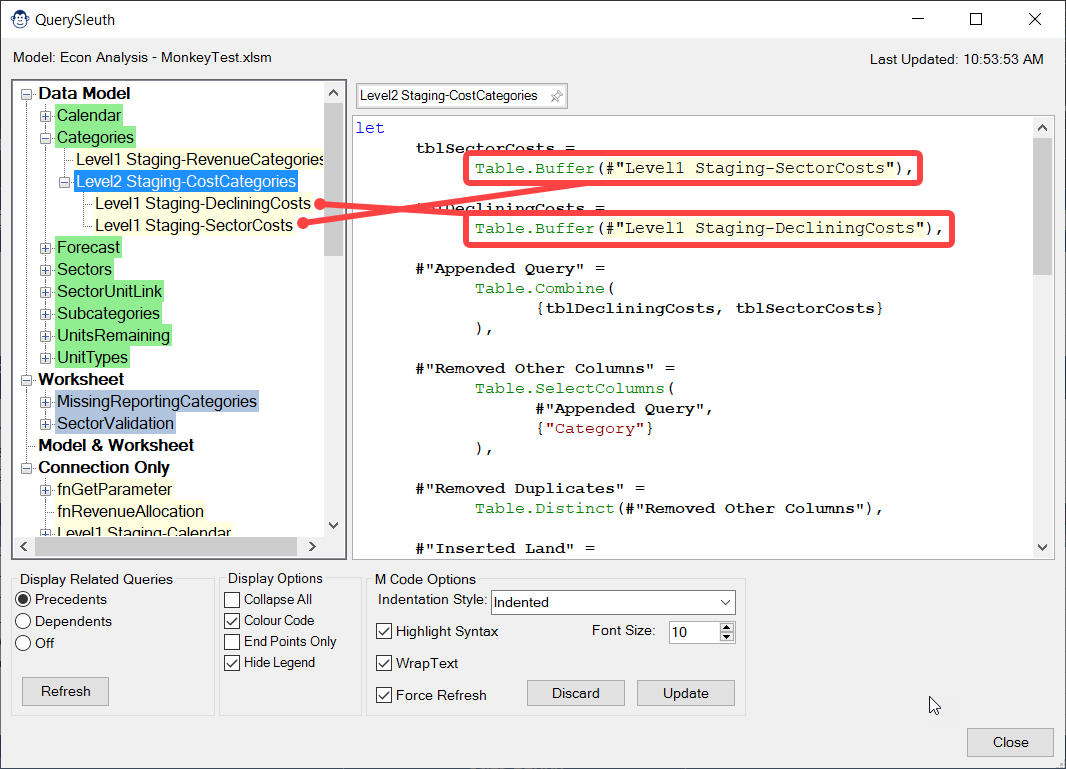
Query Sleuth helps solve this issue by placing the queries into a TreeView control, so that you can easily browse up or down the tree. And with our convenient Display option in the bottom left, you can quickly flip between showing precedents (the default view), dependents, or turn the tracing off entirely if needed.
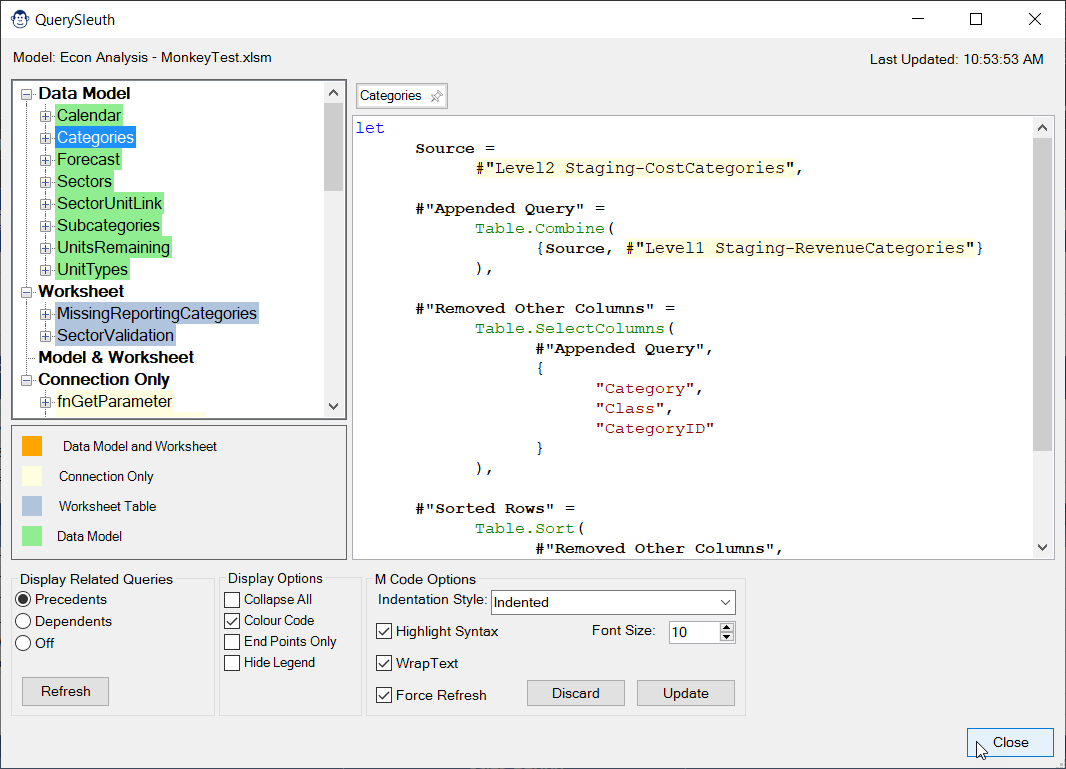
You’ll also find – when looking at the M code of any queries – that any precedent queries are highlighted right within the code, making it super easy to spot not only IF there is a precedent, but WHERE that precedent is referenced.
Query Sleuth indents and beautifies your M code by default (although you can certainly toggle these settings if you prefer Power Query’s default display styles!)
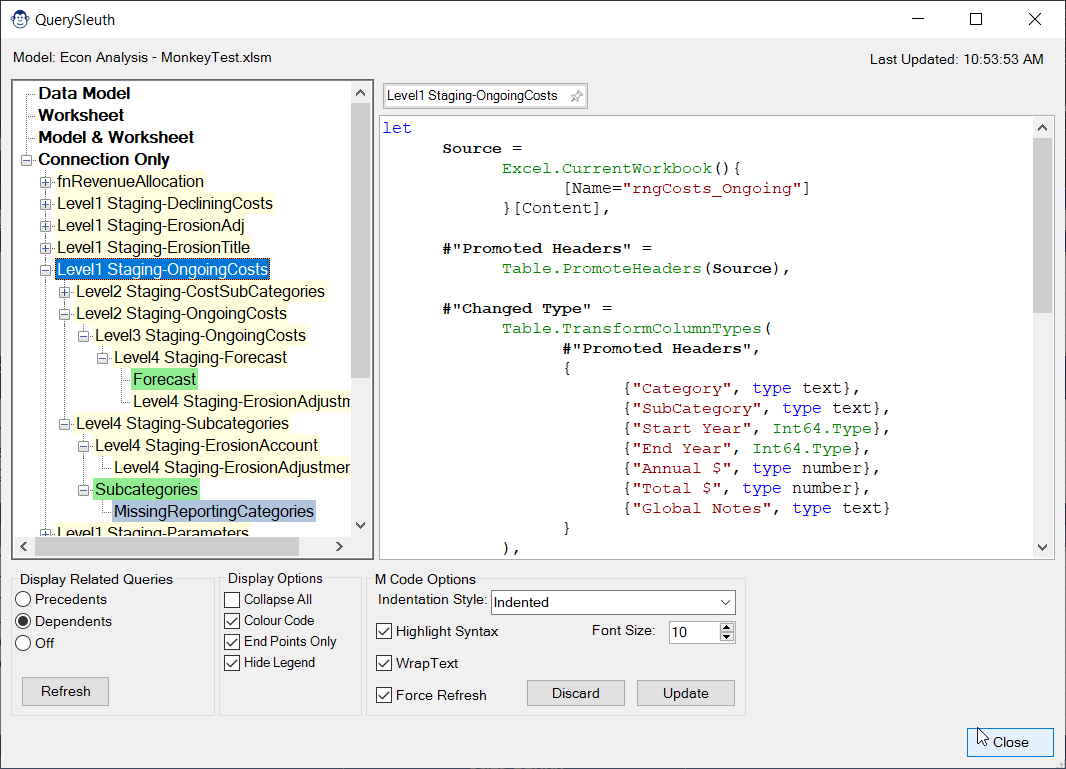
When you first open Query Sleuth, you’ll notice that your queries are colour coded in up to four different colours, in order to add a bit of extra insight around the queries. As per the legend on the form:
- Orange Queries are loaded to both a Worksheet table and a Data Model table
- Green Queries are loaded to a Data Model table (only)
- Blue Queries are loaded to an Excel Worksheet table (only)
- Yellow Queries are loaded as Connection Only
As the legend does take space, and as you’ll get used to it pretty quickly the Query Sleuth has an option to turn the legend off… permanently.
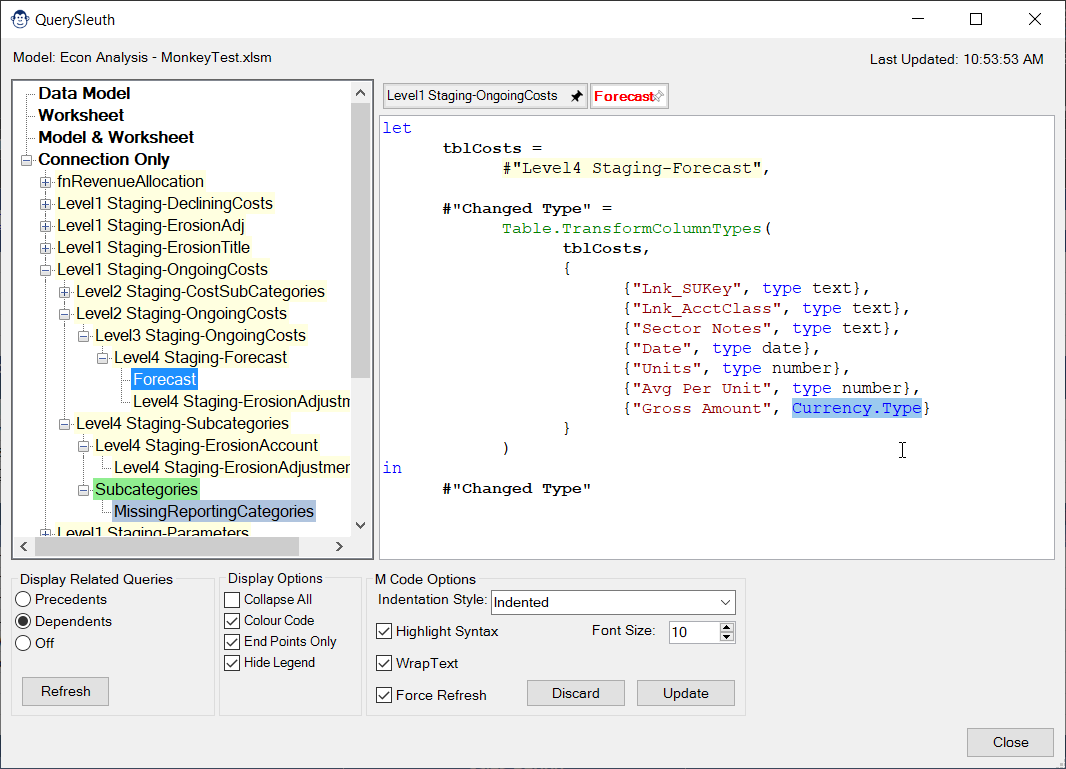
Often times the reason we are trying to trace a query’s dependency chain is because we need to make a change to a child query, and want to know which queries it could impact. If you feel comfortable making tweaks to your M code, you can do it right inside the Query Sleuth editor, without ever needing to open Power Query!
By default, switching to another query will prompt you to save any edits, but it also supports “pinning” queries so that you can easily flip back and forth to make multiple changes, and then commit them all at once.
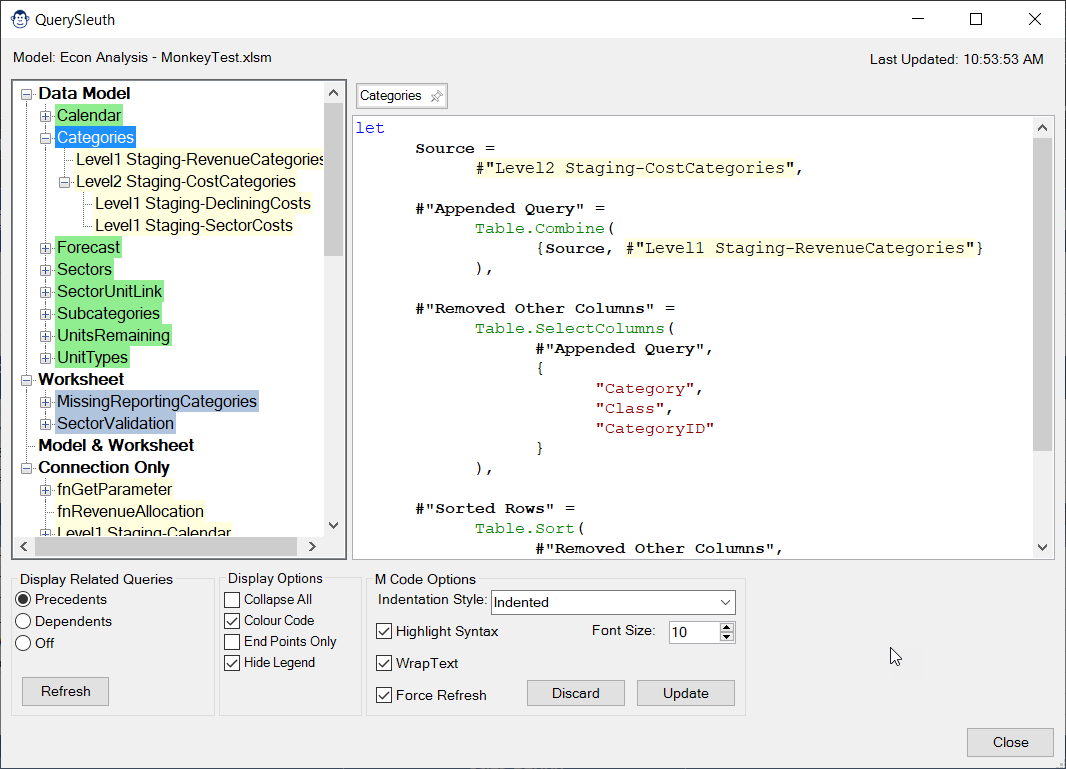
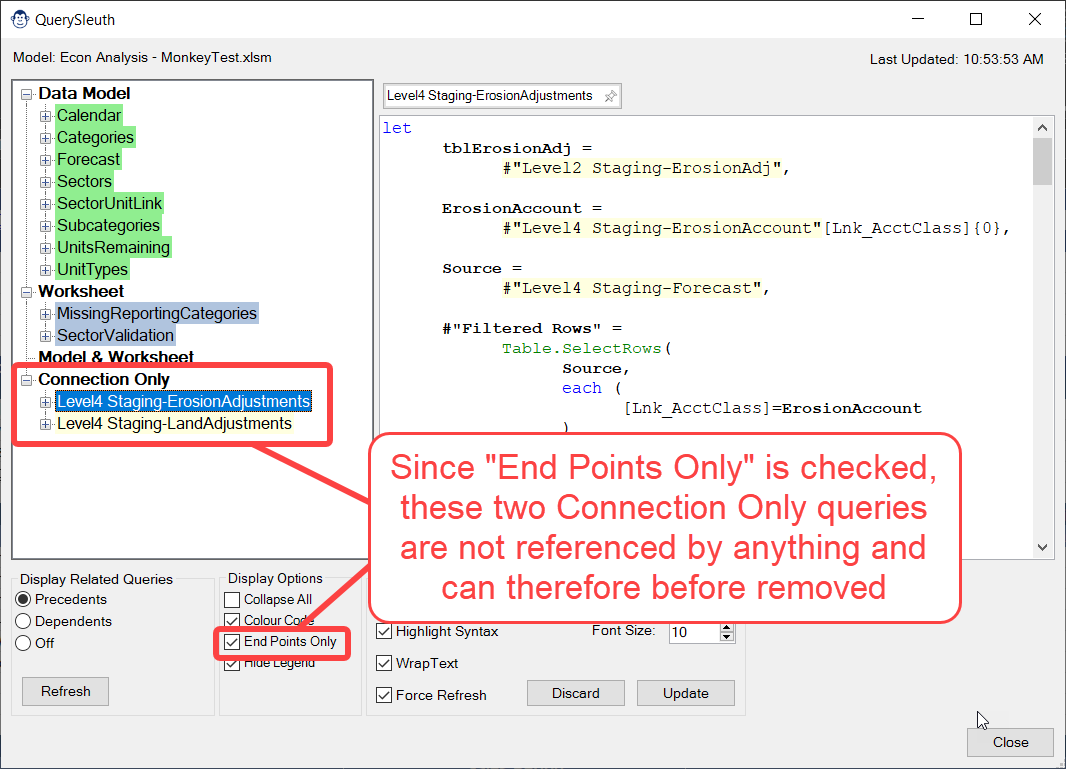
By default, every query in your solution will show in the navigation Treeview on the left side of the Query Sleuth interface. One thing you may find is, if you have a complex solution, the Treeview can get quite busy as intermediary or staging queries show up, even if they are referenced by other queries. The mysterious “End Points Only” display option in Query Sleuth helps with this, reducing the noise. How it functions depends on which display view you have active.
Choosing to display End Points only while:
Viewing precedents: Only queries which load to a worksheet and/or data model table will be listed in each Treeview group.
Viewing dependents: This restricts the Treeview to show only the first query in any dependency chain. (Generally this is queries that connect to or act as the data sources for subsequent queries.)
Of course, any precedents or dependents will still be accessible by expanding each Treeview node.
One interesting feature about this button is that, any query which remains in the “Connection Only” area when showing End Points only in Precedent view is actually not used by your solution.
The Query Sleuth can read from both Excel and Power BI models, and even Monkey Tools backup files. Unfortunately, due to technical limitations, the ability to update a query is restricted to Excel models only.
Start exploring your model today!
Time Sleuth
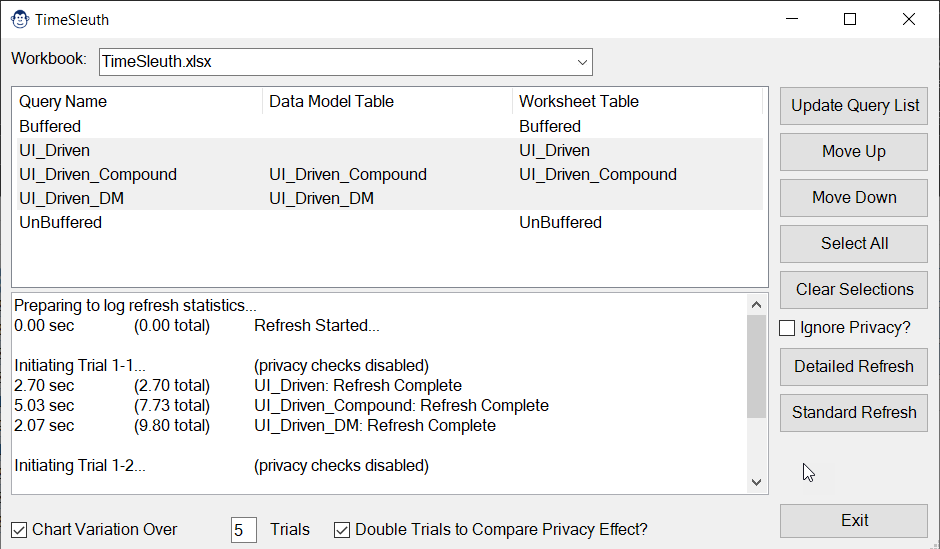
Have you ever hit the refresh button in Excel and then waited… and waited… and waited for your Power Queries to refresh? Want to know which query is causing the bottleneck? Then maybe you should check out the TimeSleuth. Not only will it time individual queries, it will even let you perform multiple runs, optionally with privacy enabled/disabled, in order to compare performance results.
By pressing the “Standard Refresh” button, the Time Sleuth will clock the total amount of time it takes to perform Excel’s standard Refresh All operation. It’s not super fancy, but it is more accurate than trying to time it yourself via a stopwatch!
As an alternative to using the Standard Refresh All functionality, the Time Sleuth also offers a Detailed Refresh All, which will time any selected queries. You have the ability to select single or multiple queries, and even change the refresh order. Upon selecting the Detailed Refresh All, the Time Sleuth will time the refresh of each of the selected queries.
It is important to understand that – because Time Sleuth is triggering a refresh on a specific query – any child queries will need to be evaluated. In addition, this functionality does not take advantage of any query child node caching. For this reason, selecting all queries and choosing to time a Detailed Refresh will always result in refresh times that are slower than a Standard Refresh All operation.
The benefits, however, are that the Time Sleuth provides a detailed list of the refresh times as it goes, and allows you to time individual queries easily. This in turn, can help shed some light on which queries are impacting the overall load time of your standard Refresh All operation.
By default, when combining data from multiple sources, Power Query checks the privacy of both data sources to make sure that it is safe to combine them without leaking any sensitive data. While this is a fantastic feature for protection, the challenge is that it affects all data source combinations and will even check privacy on two different tables in the active Excel workbook! Given the amount of overhead involved, this has been know to have a significant impact on refresh times.
Provided that you have left your privacy settings (found under Get Data -> Query Options -> Global -> Privacy) in the default state of “Combine data according to each file’s Privacy Level settings”, the Time Sleuth will let you toggle the privacy state before refreshing. This will allow you to quickly see the potential time savings by suppressing privacy checks for that data source.
NOTE: We recommend turning privacy off on a workbook by workbook basis, and only where you are not sending data outside your corporate network!
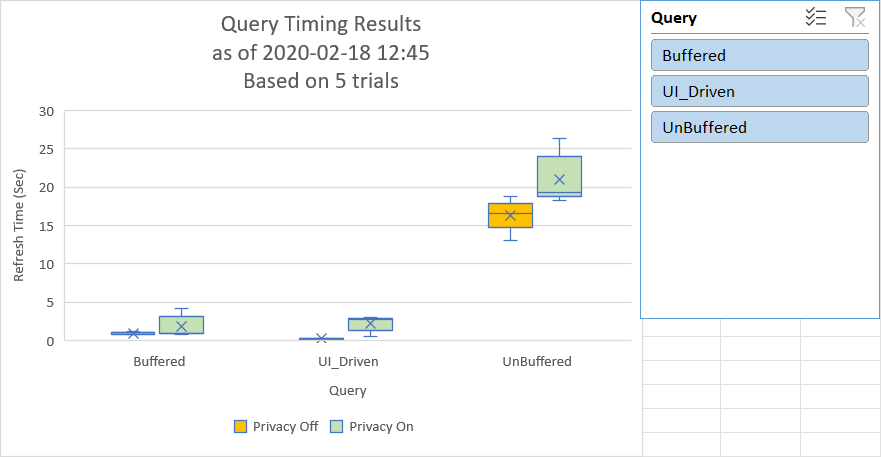
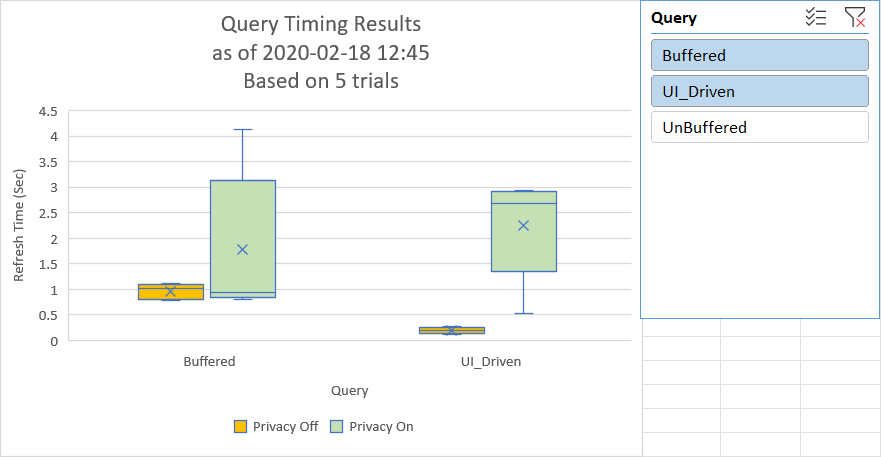
One of the killer features of the Time Sleuth is that it allows you to set up multiple tests with ease, including comparing privacy effects, and will chart the results for you.
The output report provides a nice box & whisker chart that shows the average refresh times, the standard deviation (variability) as well as outliers. With this information at your hands it becomes easy to compare the speed of two queries which do similar things, or see which query has the biggest effect on your overall Refresh All operation.
It is important to realize the following points related to Power Query and Power Pivot architecture, as they can drastically affect refresh time results:
- The first time a query is refreshed in a new Excel session, Power Query needs to initialize the Power Query engine behind the scenes.
- Power Pivot models are stored in a compressed state. The first time you refresh a Power Pivot model after the workbook is opened, there is additional overhead to de-compress the data.
- Power Query is single threaded and each complete query dependency chain gets refreshed in a single processor core. If another application happens to hit that core during the refresh, it can have a significant impact on the timing results.
- Query privacy – if active – can have a significant effect on query refresh times. And based on our experience, this is true even if the data sources being combined shouldn’t need privacy checks.
The combination of all of the above can and does lead to variations in query refresh times. For this reason, we advise that you always time your refreshes at least twice, discarding the first result.
Pivot Sleuth
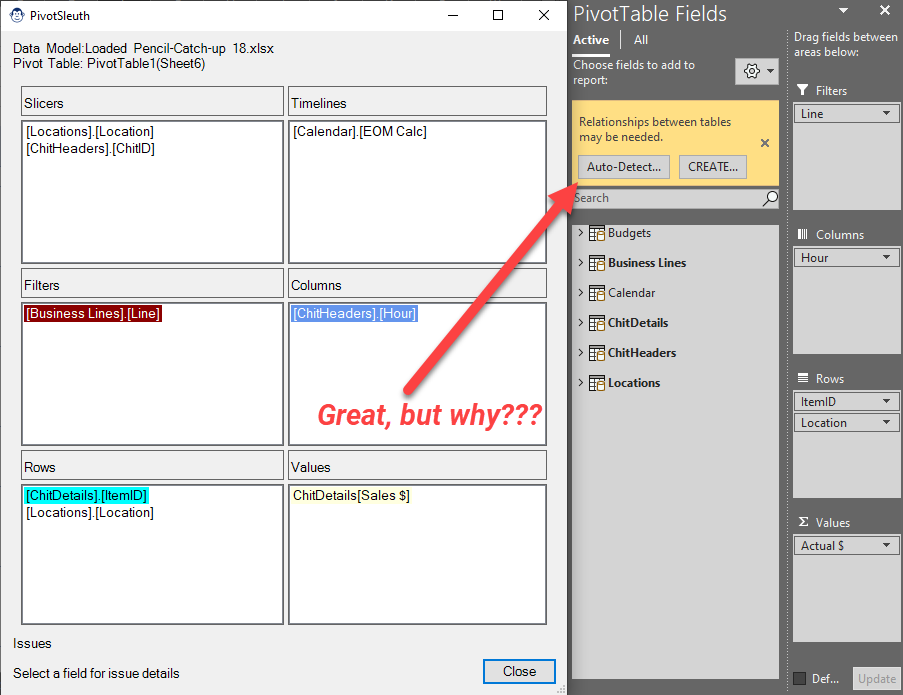
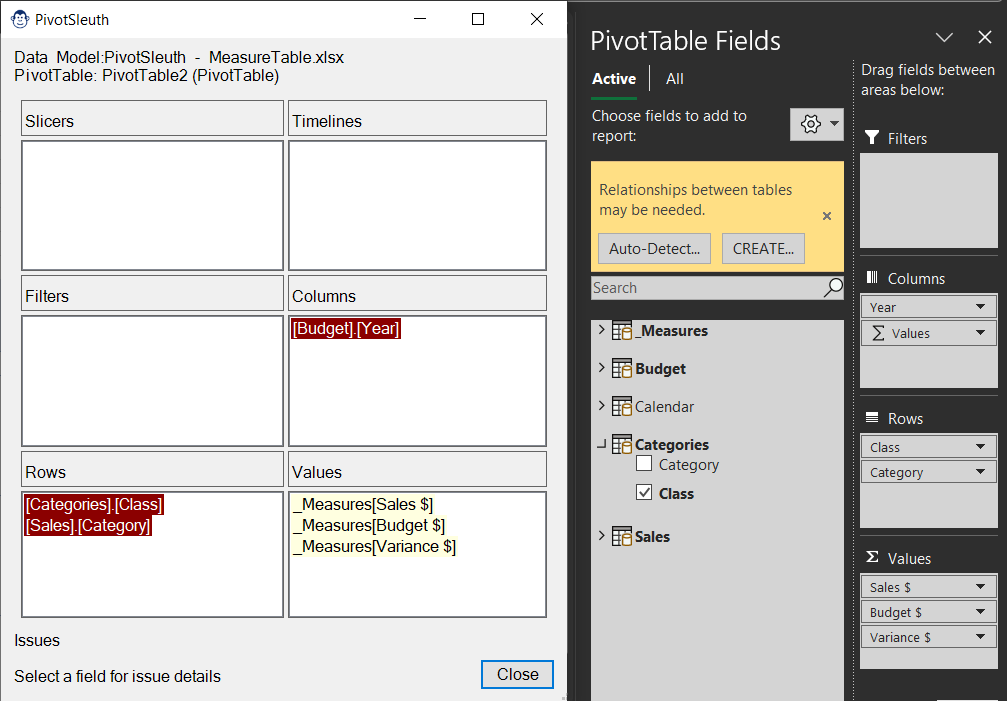

Have you ever seen that irritating “Relationships May Be Needed” error when building a Power Pivot-based PivotTable, and wondered why? PivotSleuth’s job is to help you with that. And not only will the PivotSleuth identify problems that currently exist, but it will also provide you advice on things that could lead you to error states in the future!
One of the big challenges we can face when debugging or auditing our Pivot based solutions is trying to figure out exactly which field is in use in a Pivot, Slicer or Timeline. The reason for this is that each of these objects displays the user control Caption, not the underlying data model field.
Pivot Sleuth takes a different approach, showing you the fully-qualified [Table].[Field] reference for each item, allowing you to identify if someone has used a similarly named field from an incorrect table choice. And should you need to tie back that field name to a specific Slicer or Timeline? Just mouse over the field to pop up the object’s caption and worksheet location!
Pivot Sleuth is designed to show you a familiar PivotTable style interface, but also includes all Slicers and Timelines that are connected to the PivotTable or PivotChart.
Unlike Excel’s standard Filter Connections button however, Pivot Sleuth only shows the filters that are actually connected to the Pivot, and doesn’t clutter it up with all of the other filter objects in the workbook.
Even better? If you select any of the fields in the Slicers or Timelines areas, it will even select them, taking you straight to the worksheet that hosts them!
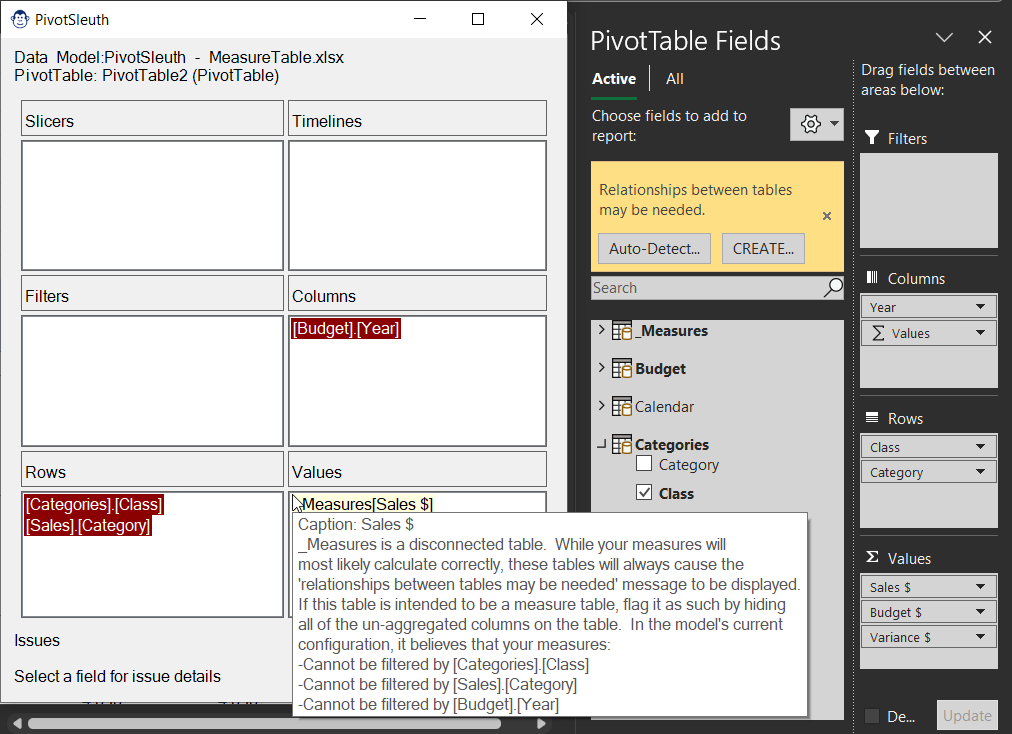
Pivot Sleuth provides colour coded context sensitive information to help you resolve (and prevent) the dreaded “Relationships between tables may be needed” message.
So how do you know what to look at? Simply look for a field that is displayed in a dark red background. Those fields are the direct cause of the message. Selecting the field will provide a complete context of all issues that are evident.
Follow this Sleuth’s advice and we’re confident that you’ll never have to deal with that irritating message again, on any Pivot!
While Pivot Sleuth helps resolve the “Relationships between tables may be needed” message, that isn’t the only thing it offers. In fact, even if you don’t see that message, you may still want to review your Pivot with Pivot Sleuth. Why? Because it can help identify potential issues in your PivotTable or PivotChart setup that may occur in future!
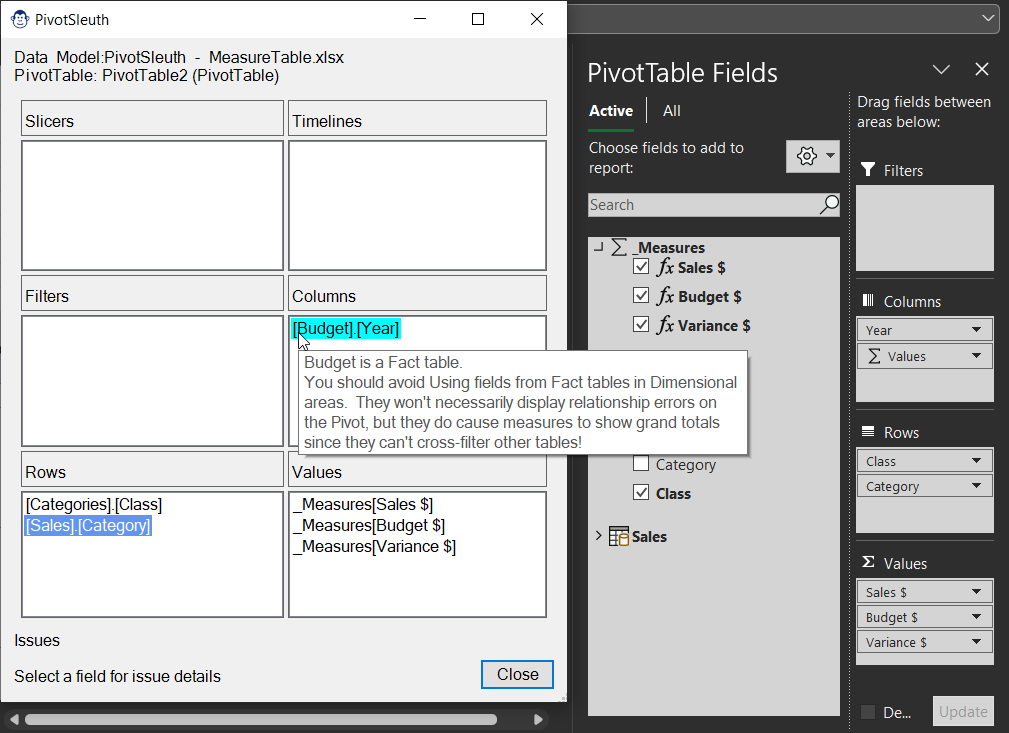
When launching Pivot Sleuth, you’ll see up to 5 different colour states displayed for each field:
- Dark Red: Indicates an active issue that is triggering the “Relationships may be needed” message.
- Light Yellow: Indicates measures that are not being filtered by other fields.
- Cyan: Indicates fields from Fact tables used in a Dimension area which are not actively causing any filtering issues, but could cause issues in future.
- Light Blue: Indicates usage of a Foreign Key (the many side of the relationship) where the choice of a Primary Key (the one side) would be safer to use.
- No colour: Indicates that the field choice is healthy and has no issues.
Pivot Sleuth will work on any PivotTable or PivotChart which is based upon Excel’s Power Pivot Data Model.
and give your models the professional finish they deserve!
DAX Sleuth
Monkey Tools’ DAX Sleuth provides a useful interface which allows you to understand, modify and trace your DAX measures.
When building complex logic, we prefer to break things down into simple building blocks. Rather than go straight from an unaggregated column to a complex time intelligence measure, we prefer to start with a simple explicit SUM() of a column, and then build measures that gradually modify the base measure to return our output. This promotes re-use of tested measures, and helps make sure that a bug fix to a base measure will roll through all measures in the model.
Unfortunately, one area that Power Pivot offers no help is with tracing DAX dependencies. The Manage Measures is your best option, but it is very tedious to use as you have to keep opening and closing different measures, reading the DAX to find any precedents. The primary purpose of this tool is to solve that problem.
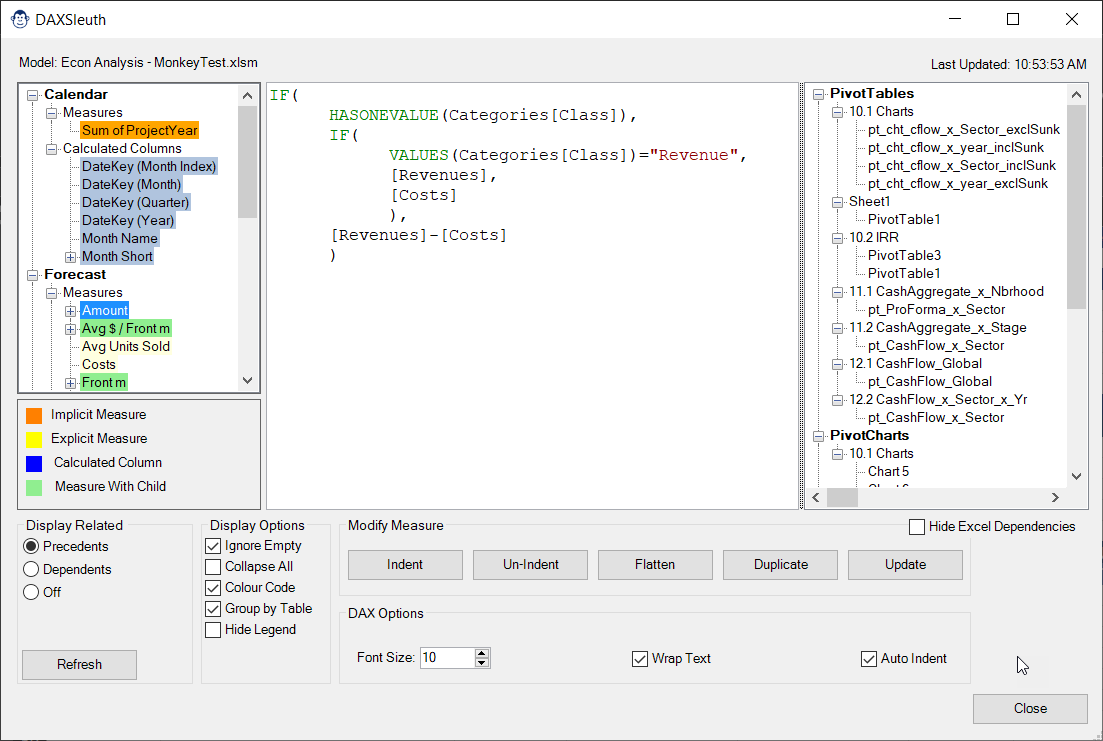
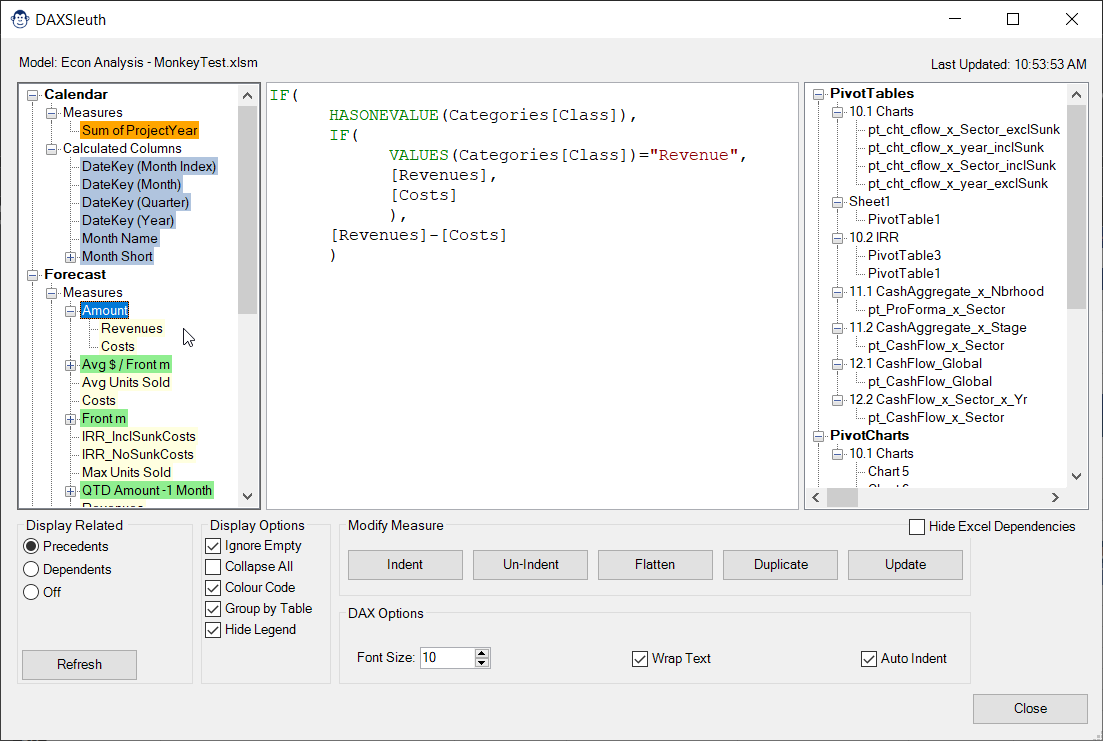
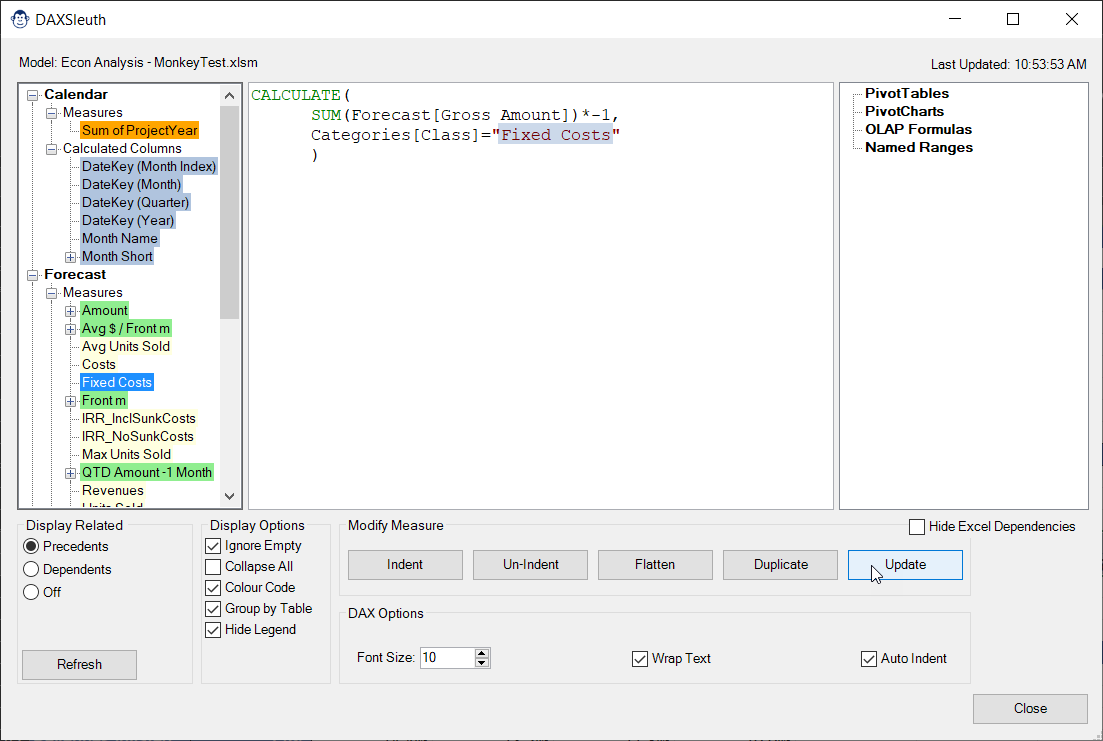
DAX Sleuth loads every DAX formula into the Treeview on the left side of the form, whether it is a Calculated Column or a Measure, and displays any precedents (by default) as child nodes. Of course, with a simple switch of the Display option in the bottom left, you can flip this to show dependent measures instead, giving you the ability to trace up and down the DAX dependency chain as needed.
DEX Sleuth indents and beautifies your DAX formulas by default (although you can certainly turn the identing off if you prefer to!)
When you first open DAX Sleuth, you’ll notice that your formulas are colour coded in up to four different colours. As per the legend on the form:
- Orange highlighting indicates Implicit measures (which may be hidden in your model)
- Blue highlighting indicates that the formula is in a Calculated Column in the Data Model
- Green highlighting tells you that a measure also has child measures that contribute to its value
- Yellow highlighting indicates a measure with no precedents
As the legend does take space, and as you’ll get used to it pretty quickly the DAX Sleuth has an option to turn the legend off… permanently.
Besides the manual modifications that you can make to the DAX in the formula window, the DAX Sleuth contains several options for formula modification as well.
Before we cover the modification, it is worth noting that DAX Sleuth displays your formulas indented by default, but that doesn’t mean that they are actually indented in the model. If you’d like to review what you’ll see in any of Power Pivot’s native dialogs, un-check Auto-Indent to see what the model really contains.
With that out of the way, let’s look at the options the DAX Sleuth provides:
Indent (Un-Indent): These buttons allow you to toggle your DAX between indented and un-indented versions. And if you’d like to write the format back to the data model, just click the Update button!
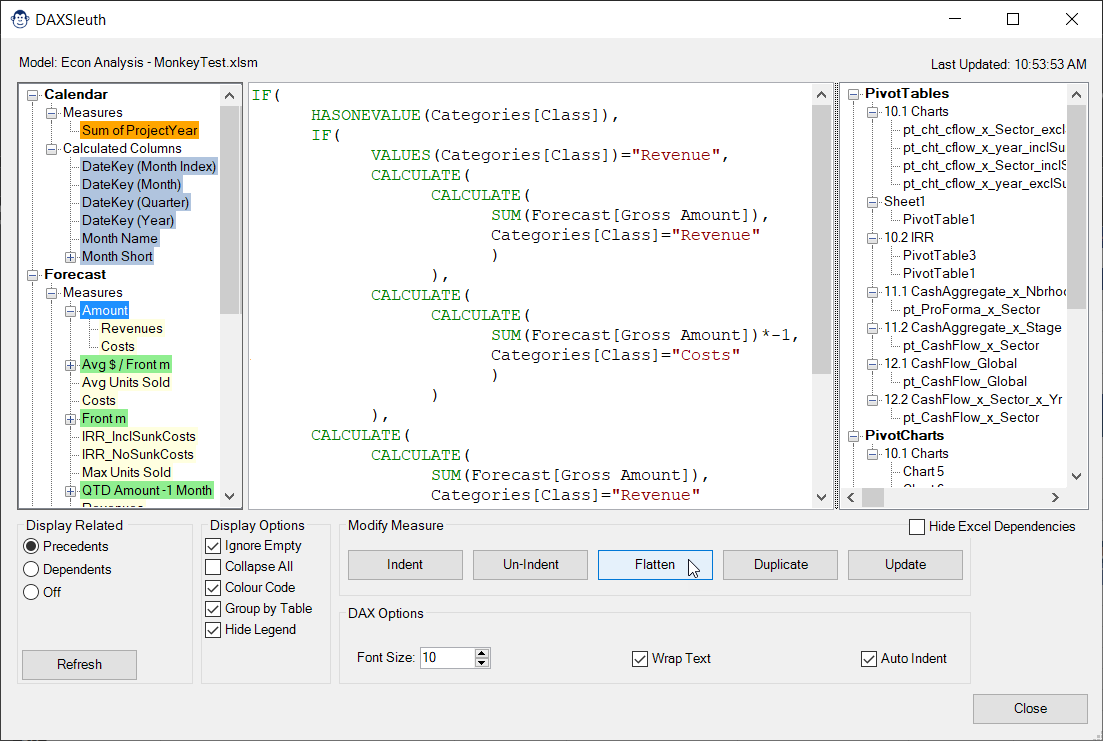
Flatten: This button will grab all child measures, wrap the in CALCULATE() (to ensure proper context transition) and swap the resulting formula in place of the child measure in the selected formula.
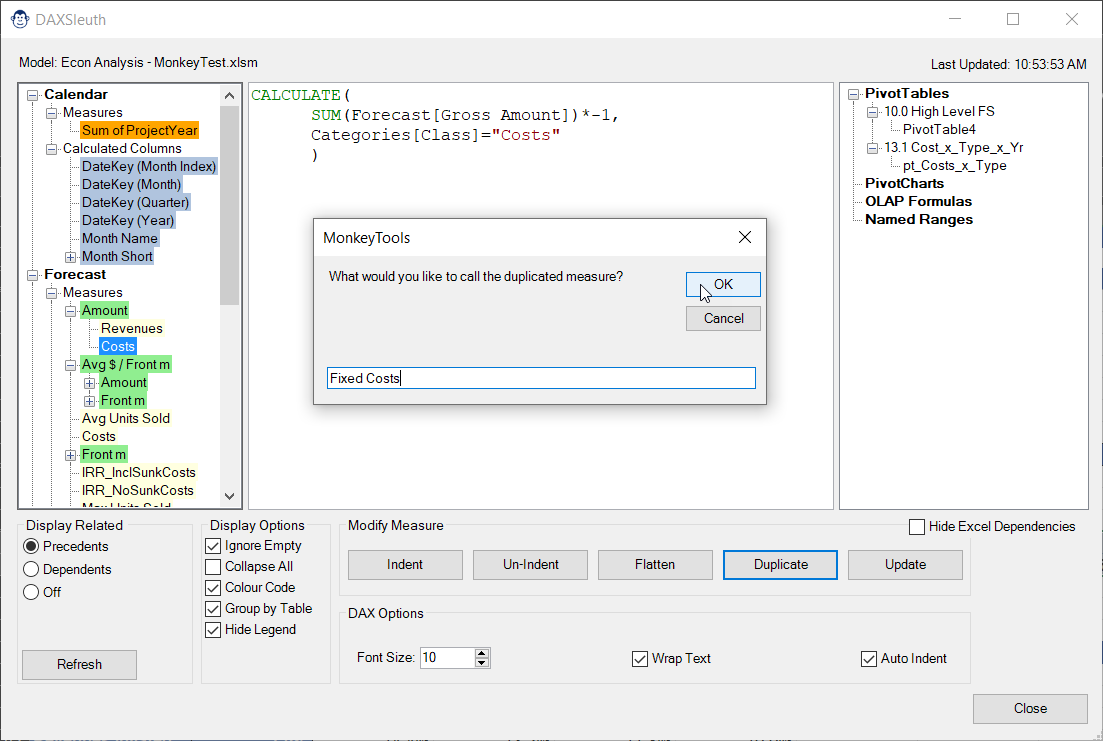
Duplicate: Prompts you for a new measure name and then creates an exact duplicate of the existing formula, complete with the original measure’s default formatting. Handy for duplicating measures which only need a small change (like a filter in a CALCULATE() statement). All that is left to do in this case is modify your copied formula and press the Update button to write it back to the model.
And the cool thing? While this works in Excel, it also works against Power BI models if you happen to be auditing one and notice something that needs to be fixed.
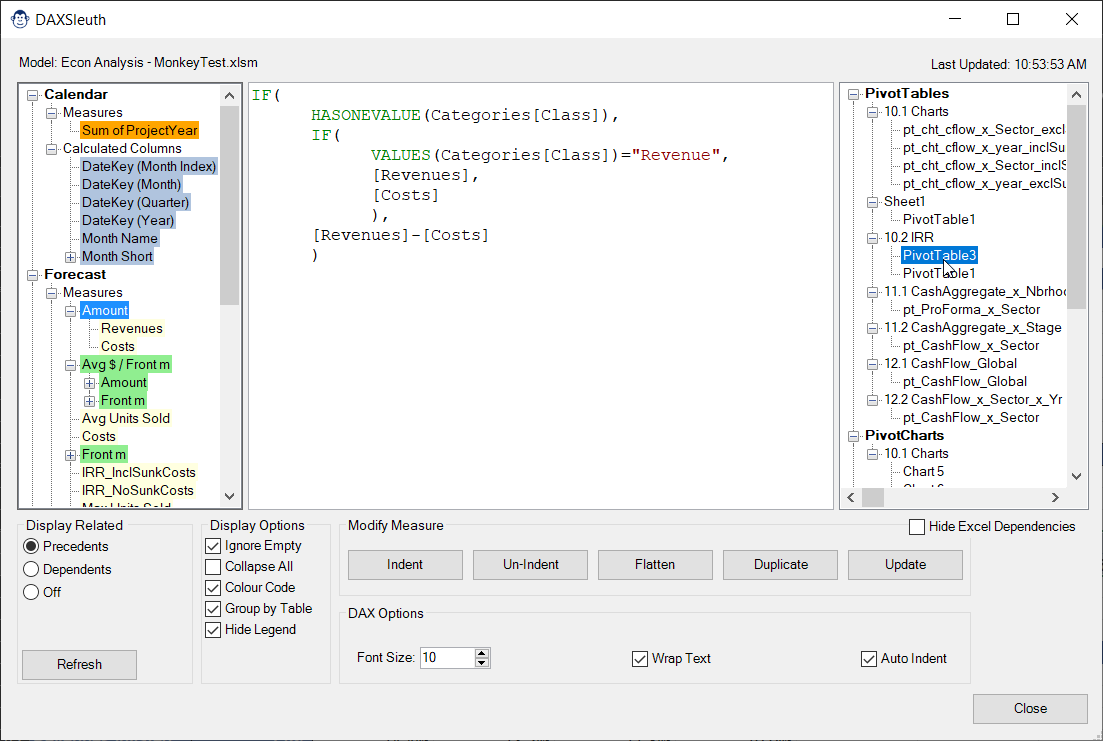
Have you ever wondered exactly where a Calculated Column or Measure is actually being used inside your workbook? DAX Sleuth will help you wonder no more!
On the right side of the DAX Sleuth you’ll find a collapsible pane which lists all objects that refer to the given DAX formulas. PivotTable, PivotCharts, OLAP CUBE Formulas and more are grouped by type and listed by worksheet and the hosting object. Select one, and DAX Sleuth will do its best to take you right there!
The DAX Sleuth can read from both Excel and Power BI models, and even Monkey Tools backup files.
While DAX Sleuth won’t write back to Monkey Tools backup files, it can (and will!) write back DAX formula changes to both Excel and Power BI models.
Note that the Excel Dependencies navigation pane is only shown for Excel models.
Model Sleuth
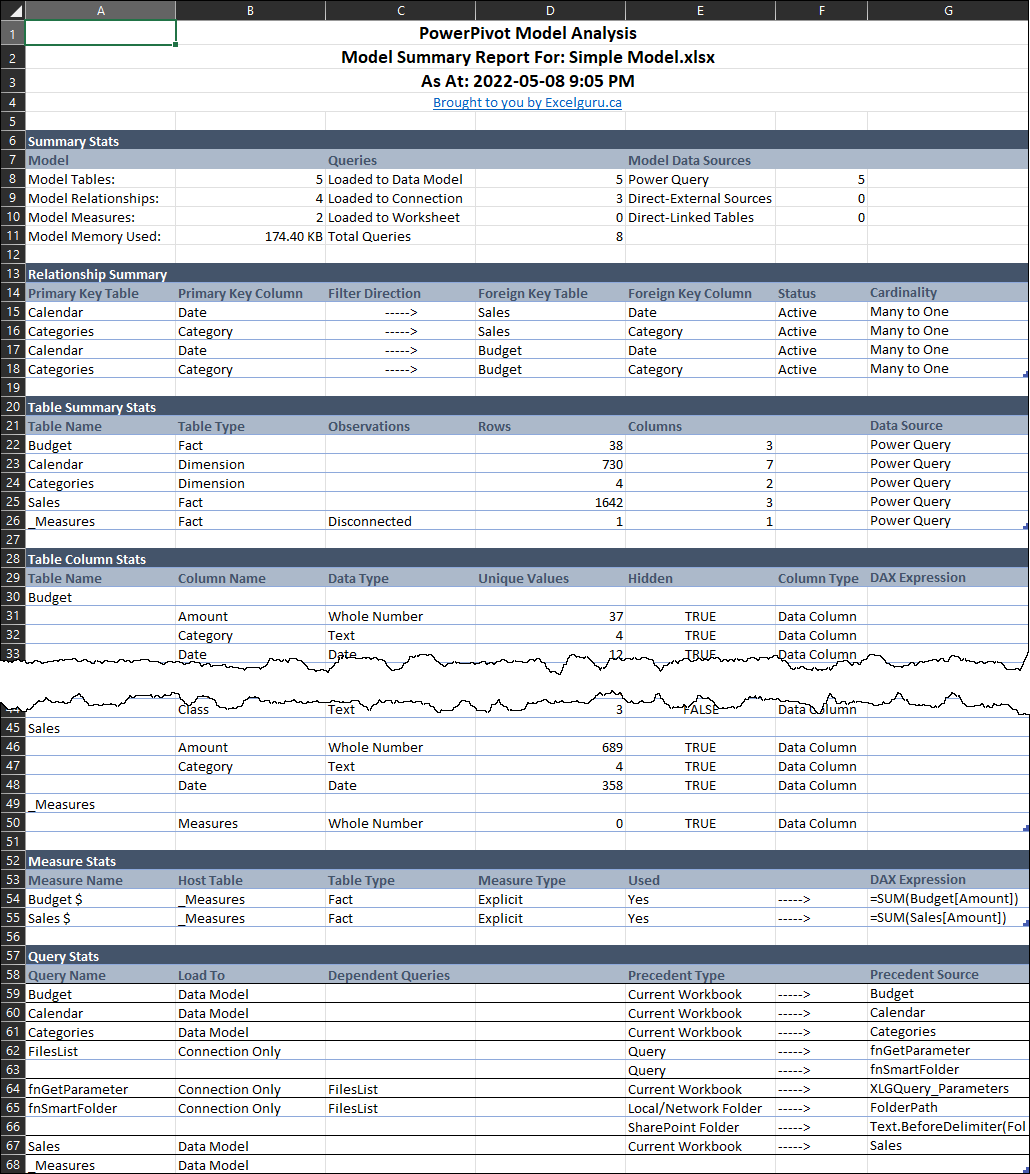
Have you ever had to provide documentation for your model? Or picked up a model from someone else and had to review it? The Model Sleuth provides a variety of reports and tools to analyze and document your Excel and Power BI models including:
In this report, the Model Sleuth delivers a full model summary showing key statistics about your tables, relationships, columns, measures, and queries. It’s documentation done right – and fast!
NOTE: Trial and Free licenses are limited to every other record in this report.
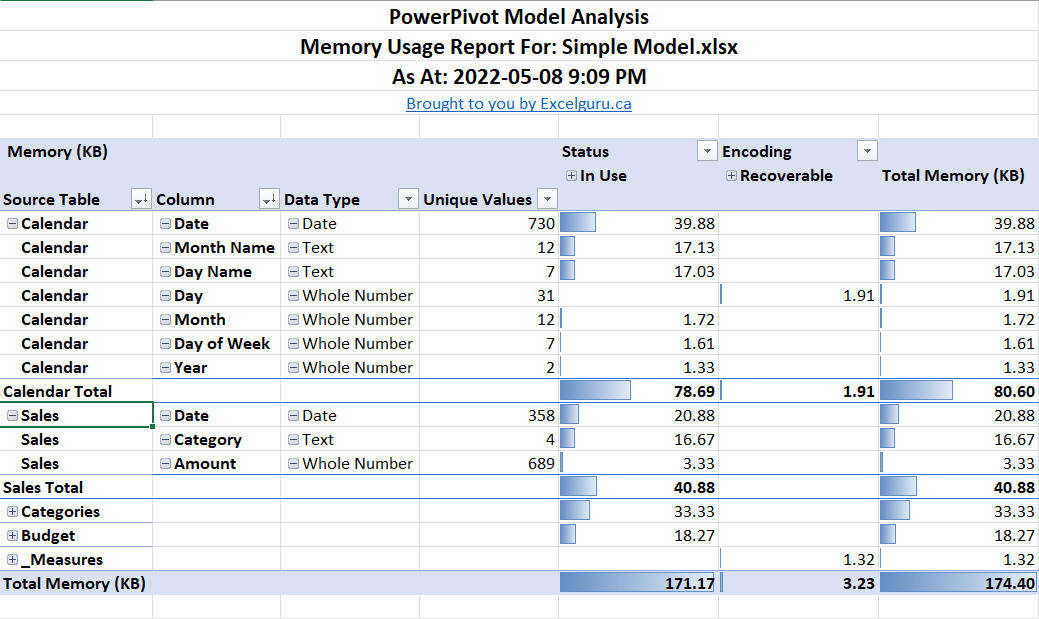
If there is one thing that Excel pros are famous for, it is grabbing too much data “just in case” they need to analyze it. In this report, the Model Monkey show you exactly how much memory that data is costing you.
As an added bonus for Excel users, the Model Monkey breaks down your memory usage to show what is actually needed to drive your reports, versus the data that is just added weight that serves no purpose other than slowing down your refresh and slice times.
Remember, lean models are faster to refresh, faster to slice, and more stable overall!
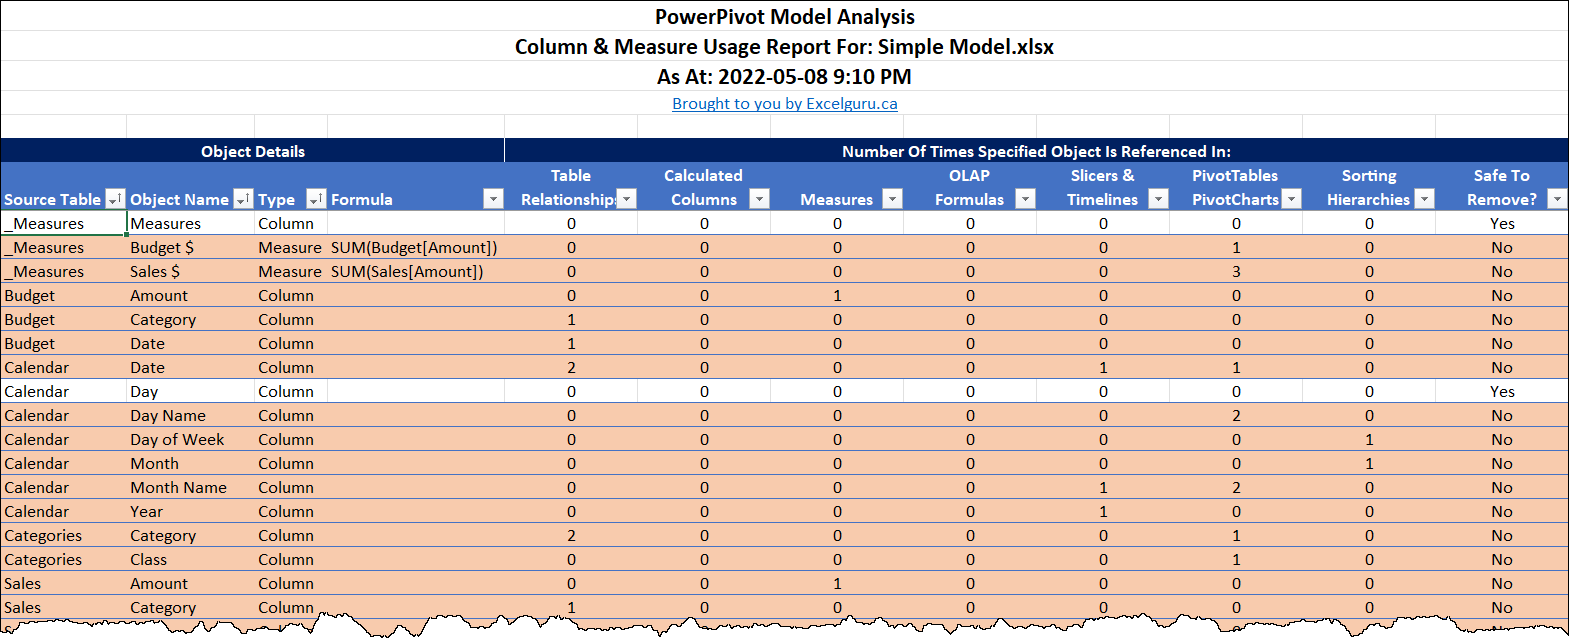
The Model Monkey’s Unused Columns report provides a filtered list letting you know which columns in your data model are not being used for anything, and are safe to remove. In order to provide this information, the Model Monkey checks anything that could refer to a column including DAX Formulas, relationships Pivot Tables, Slicers, CUBE functions and more.
The summary is provided in a format that is filtered to show only the columns that can be dropped, but can be unfiltered to see the count of references to the column by object type.
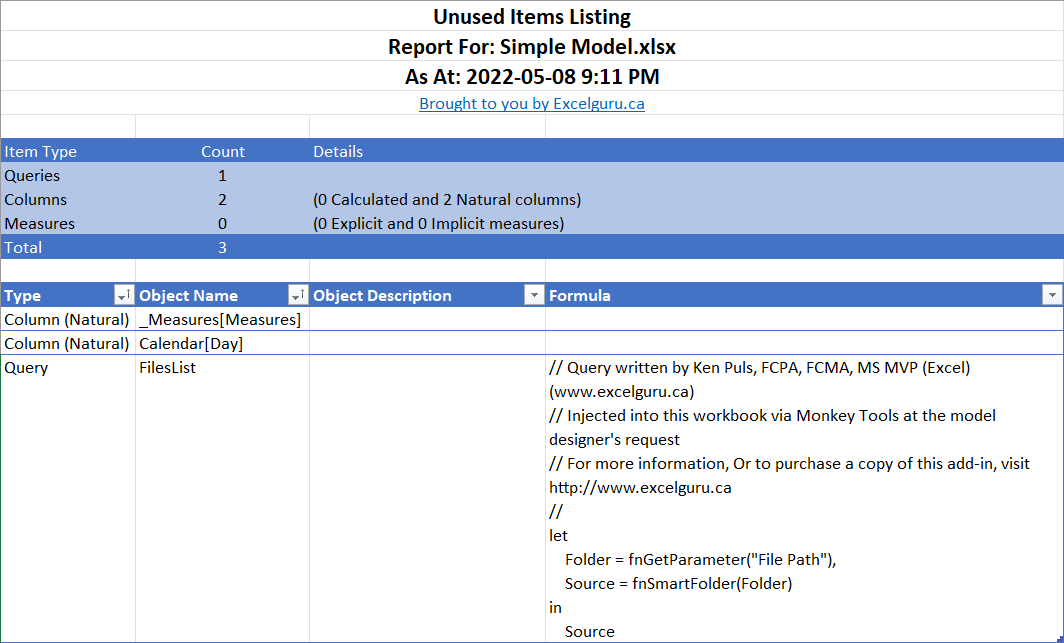
The Model Sleuth’s Unused Items report allows you to quickly identify any of the following unused items so that you may remove them from your Excel solution:
- Unused Queries (connection only queries with no dependencies)
- Unused Data model columns
- Unused DAX measures (implicit and explicit)
Need to make sure your file is lean and mean before you send it to a client? Trust this Monkey to help you minimize your file and make you look super efficient!
NOTE: Trial and Free licenses are limited to every other record in this report.
For those technical users who really like to get under the hood, the DMV Sleuth offers a simple DMV extractor to connect directly to the data model’s SQL-based Dynamic Management Views.
The DMV Monkey provides access to all SYSTEM.DISCOVER DMV’s for Excel models as well as SYSTEM.TMSCHEMA DMV’s for Power BI models. All you need to do is choose which DMV you’d like to see and click Create to have the results landed into a new Excel table.
In addition, for those who bring their own SQL skills, the generated SQL queries can be customized to your heart’s content, allowing you to pull exactly what you need. (Please note, we do no provide syntax checking for modifications to the SQL queries.)