Monkey Tools

TimeSleuth

Article Overview

One of the realities of building complex models is that we build models which take a long time to refresh. While timing with a stopwatch is easy, working with complicated query chains makes things harder, as your stopwatch can only time the global refresh.

Have you ever wanted to:

  • Time all queries in a refresh to see which of your child queries is impacting your load time the most?
  • Create two queries and compare them to see which loads faster?

That is exactly what this Monkey helps you achieve; it to allows you to test the global or individual refresh times of queries within your workbook.

Working with the TimeSleuth

The TimeSleuth User Interface

Immediately upon launching this tool, the form will pre-populate with the active workbook, and list all its queries which load to an output destination. Should you wish to analyze a different (open) workbook, simply select it from the drop-down list. At this point, you will then be presented with a list of all the queries in the workbook and will be able to time their refresh performance.

If you appear to be missing any queries, click the “Update Query List” button. (As this form is non-model, you can make updates to your queries while the form is open.  If you do so, the Monkey needs to be made aware of this fact.)

There are three main ways to use the TimeSleuth in Monkey Tools. They are:

  1. Standard Refresh All: This button replicates the Refresh All feature of Excel, allowing you to time a normal refresh
  2. Detailed Refresh All: This button refreshes each loadable query individually, recording the individual and cumulative times of the refresh. This feature is useful for working out which queries could benefit from performance tuning.
  3. Refresh Selected: This button allows you to refresh selected queries only, allowing you to ignore queries that aren’t relevant to your current goals.

Working with each of these queries is described in more details below.

The TimeSleuth showing the results of a detailed refresh.
TimeSleuth showing results of a detailed refresh.

The only other button that has not been discussed in this chapter is the “Update Query List” button. As this form is non-modal, it means that you can make changes to the workbook’s query chain while this form is open. Should you do so, you’ll need to click this button to refresh the list of the Power Queries in the form.

Understanding Power Query Refresh Times

How Refresh Times are Impacted by Single Threaded Processing

Before you dive into using this tool, it is important to be aware that the overhead of Power Query’s mashup engine can fluctuate. Because the Power Query engine is “single threaded”, any related query chain can only be refreshed on a single processor core. Due to this fact, the engine is highly susceptible to other programs running on the same machine. In other words, if your OneDrive sync client kicks off a huge sync on the same core that your refresh is running on, it could significantly impact the load time for that run.

Given the above, this feature is of limited use for performance tuning queries with low refresh times. It is better suited to timing long running queries to see which is causing the bottleneck in your overall chain. The main focus is to get the overall magnitude of a query refresh, not try to shave out a millisecond at run time, as each run will be susceptible to other running processes.

To get the most accurate read of a query refresh time, we do recommend trying to eliminate “processor noise” during testing. To do this, shut down all unneeded applications and focus just on the timing task at hand.

How Refresh Times are Impacted by Privacy Level Settings

Another feature that can have a significant impact on query refresh times is Power Query’s Privacy setting. We allow toggling this setting via the checkbox on our form so that you can test the effect of query load times with this setting turned on or turned off.

The “Ignore Privacy?” checkbox on the right side of the form will inherit the setting that is defined for the workbook under the following area:

  • Get Data -> Query Options -> Current Workbook -> Privacy

If this option is greyed out, it means that your workbook is locked to a specific setting. In order to toggle this checkbox, your global privacy settings must modified via:

  • Get Data -> Query Options -> Global -> Privacy
And set as shown in the image here:
(For reference, this is what we recommend setting as your default state in order to allow controlling privacy on a workbook by workbook basis.

During the process of testing refresh times, it is highly likely that you’ll find the performance to be significantly faster with Privacy disabled. It’s very tempting to just disable Privacy on a global basis, but this is not recommended.

In order to protect you, Power Query tries to validate the privacy levels of each data sources to be combined, which is why you’ll occasionally get prompted to define Privacy Levels (public, private or organizational) for your data. The intent of this feature is to prevent you from combining public data sources with private or organizational data, thereby preventing you from accidentally leaking information.

To help understand why the privacy levels exist, and what they do, consider the following example:

In Canada, every person has a Social Insurance Number (or SIN) that we provide to an employer. This is our unique identifier that is associated with our earnings and reported to the Canada Revenue Agency. It’s obviously a pretty important and sensitive piece of information. One of the things that many people don’t realize, however, is that there is an algorithm that can be run on any SIN number to ensure that it is valid.

Assume you have an Excel spreadsheet of employee SIN numbers, and you try to send it to a Web API to validate the number. If you’ve left your global Privacy Levels as we recommend above, you would get prompted to define the Privacy Level of the Excel spreadsheet (Organizational) and the web service (Public). At this point – because the privacy levels do not match – you would be told that you can’t combine Organizational and Public data. Why is this a big deal? Because you shouldn’t be sending your employee’s private SIN numbers outside the corporate firewall unencrypted!

The challenge, however, is that even if all your data resides inside the corporate firewall and the privacy levels do match, privacy still gets checked for your data sources which has a significant speed impact. Because all of the data sources are inside the corporate firewall, it is safe for privacy to be disabled.

Understanding TimeSleuth's Various Refresh Methods

Standard Refresh

This button emulates and times the regular Refresh All behaviour triggered via Excel’s Data -> Refresh All button.

To use it, simply load the form and click “Standard Refresh All”.  The Refresh will run, and return the execution time to the main body of the form.

Detailed Refresh

The Detailed Refresh button provides much more information than the Standard Refresh and can be launched by simply clicking the “Detailed Refresh” button.

Rather than execute Excel’s Refresh All functionality, the Detailed Refresh button refreshes every query individually (in the order they are shown in the top table). During the refresh, times are captured for the individual query (shown on the left side of the window), as well as the cumulative time (shown in parenthesis.)

Queries are always refreshed in order from the first item in the table at the top of the form to the last. Should you wish to change the refresh order of the queries when timing, you can easily do this by:

  • Selecting the Query in the top table
  • Selecting Move Up or Move Down as required
  • Running the Detailed Refresh

Refresh Selected Queries

One great benefit of being able to time queries in Power Query is when you can make multiple versions of the query and see if one performs better than another.

To time a single query, just select it in the query listing at the top of the form, then click the Detailed Refresh button.

To select multiple queries, you have a few options:

  • Click the first query you want, hold down SHIFT, and click the last query you want. This will allow you to select a contiguous block of queries to be tested.
  • Click the first query you want, hold down CTRL, and select other queries. This will allow you to select multiple queries that are not adjacent to each other.
  • Click the Select All button to select all queries.
  • Click Clear Selections to clear the selections and start over.

Once you have the appropriate queries selected, press the Detailed Refresh button to kick off the query timing process.

Advanced Testing and Results Analysis

Setting Up Advanced Testing

Due to the volatility of the Power Query engine, getting a true benchmark of query performance should be accomplished by running multiple tests and comparing results. For this reason, you’ll find an option at the bottom of the form to “Chart Variation”.

Once you have checked this box, you will be given the following options:

  • Declare how many trials you’d like to chart. We recommend 5 to start as this strikes a reasonable balance between tying up your machine and generating sufficient results to draw conclusions.
  • Double runs to compare Privacy effects. This can be interesting, but it comes with a BIG caution as this can tie your computer up for a long time while the refreshes are being executed!
It is also worth knowing that the during the first run, Power Query can incur extra overhead for things like initializing the Power Query engine, as well as generating query execution plans.

Interpreting Test Results

Once the timing runs have completed, the TimeSleuth form will close automatically, and present you with box and whisker chart. A sample chart of a model (which took over x minutes to refresh) can be seen below.

If you’re not familiar with the Box & Whisker chart, it provides a ton of information, which can be summarized as follows:

  • The “x” is the mean (average) of the results
  • The line in the middle is the median of the results (50% of values are greater or lower)
  • The box contains all values less than the top 25% of time and greater than the bottom 25%
  • The whiskers show the maximum and minimum values, excluding outliers
  • Dots are used to represent outliers that fall way outside the range

Okay great, but what does that mean to you?

Essentially, the smaller the box, the less variation in timing. If we focus on the green series in the charts above, we can see that there are some long refresh times and huge variations for the Budget and Calendar queries.  The sales query, on the other hand executes in about 2.5 seconds virtually every time.  You’ll also notice in the first chart (charting 5 runs), that the Categories query refresh time seem longer and variable. But in the second chart, with 30 runs in place we can see that this query may perform better than originally suspected.

Keep in mind that 5 trials is definitely not considered a statistically significant sample. As a general rule, the faster your queries execute, the more they will be subject to variation over multiple runs. If you see a chart like the first chart above, with very low execution times, it may be worth re-running it with a larger number of trials.

For a great article on understanding how to read a Box & Whisker chart, see Nathan Yau’s article on reading Box and Whisker plots at flowingdata.com

Interacting With the Chart

Hiding or Showing Privacy Effect Comparisons

There is a lot of data on the original chart, but you can reduce it to hide one of the series:

  • To hide the “Privacy Off” series: Right click Column B’s header -> Hide
  • To hide the “Privacy On” series: Right click Column C’s header ->Hide

To bring the series back, use the following steps:

  • Select columns A:D
  • Right click the column A header -> Unhide

This should restore the chart to show both series of data.

Focus on One or More Specific Queries

While the global trend is interesting, what if you now want to drill in to compare the results of one or more specific queries? 

Doing this is much easier than the previous section: simply select the series you wish to focus on in the slicer. (Remember that you can select multiple items by holding CTRL as you click them.)

See the TimeSleuth in Action

Curious to see how the TimeSleuth actually works?  Check out the recording of Ken’s presentation for the KSA Excel User Group where he first introduced the TimeSleuth feature.

Share:

Facebook
Twitter
LinkedIn

Related Posts

DMVSleuth

Coming Soon! Sorry, but this article isn’t quite ready yet. We promise that we’re working on it! In the mean time – until we get

ModelSleuth

Coming Soon! Sorry, but this article isn’t quite ready yet. We promise that we’re working on it! In the mean time – until we get

DAXSleuth

Coming Soon! Sorry, but this article isn’t quite ready yet. We promise that we’re working on it! In the mean time – until we get

PivotSleuth

Coming Soon! Sorry, but this article isn’t quite ready yet. We promise that we’re working on it! In the mean time – until we get

QuerySleuth

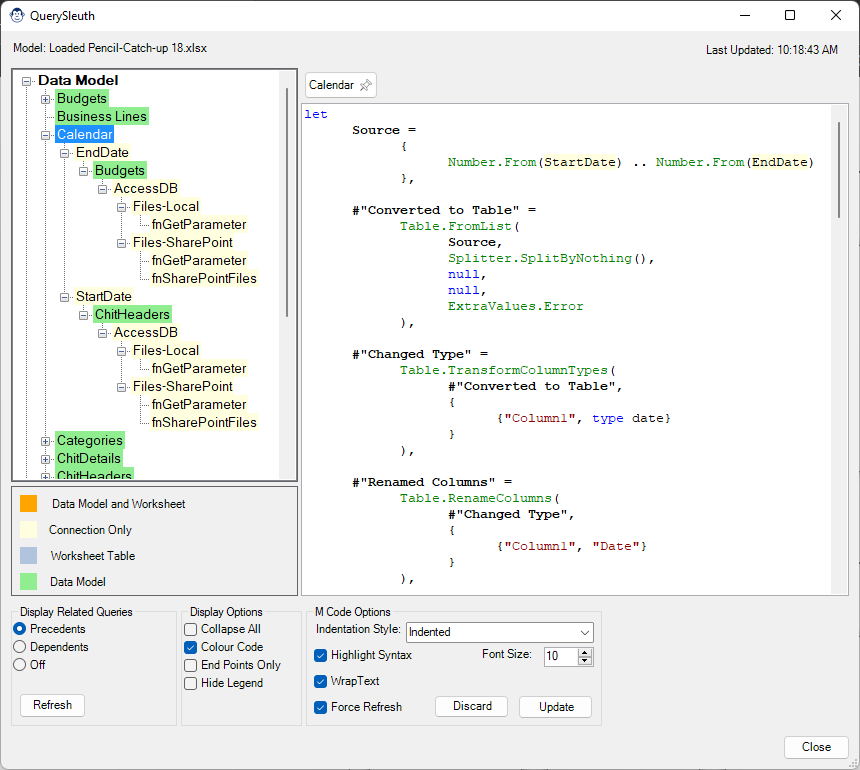
Article Overview Query Sleuth is one of our smartest Monkeys.  Not only does it allow you to review, edit and indent the M code for