
Excel Feature Improvements
Article Overview Monkey Tools offers several Excel feature improvements to build a better user experience. While the vast majority of these features are custom-built to
While PivotTables and PivotCharts are a useful and valid way to summarize your data, sometimes you want a good old table.
While it has been possible to do this with Power Pivot-backed data models since day 1 of Power Pivot, it has required some black magic and DAX knowledge to make it happen. The goal of the DAX Table Monkey is to make this super easy using the “no-code” / “low-code” approach that we love to take.
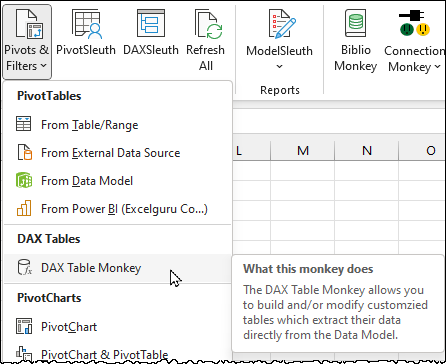
Before you can use the DAX Table Monkey, you must make sure that you have either:
Yes, it is just that simple. Open your Power Pivot-backed workbook and just go straight to the DAX Table Monkey. The monkey will read your model and present you with its easy-to-use user interface.
Yes, you read that right! Our Monkey can create DAX tables against hosted Power BI models with no fuss. To get started:
(The PivotTable worksheet can then be deleted, as we only needed the connection.)
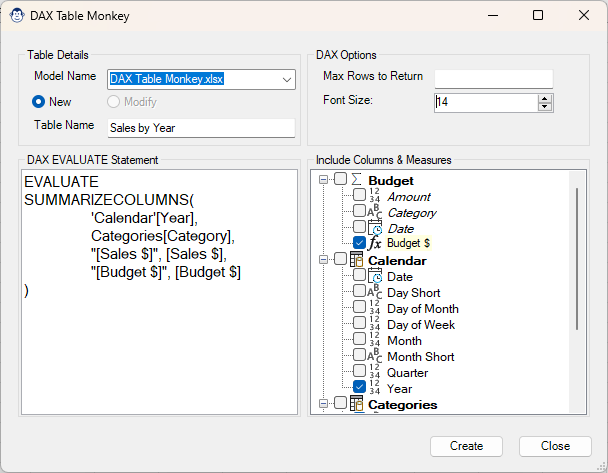
The DAX Table Monkey aims to make your DAX table configuration easy – you check the fields you wish to add, and our Monkey writes the DAX for you. Click Create when you are finished choosing columns, and the rest is done for you!
When in this Monkey, you’ll notice that you also have a few options at your disposal:
It is also worth noting that Measures show up highlighted in yellow in the selection box on the right hand side.
After clicking the Create button, the result of the query above is a simple table which will refresh automatically when the data model is refreshed.
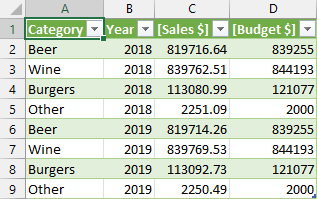
When using the DAX Table Monkey, you’ll notice that columns will always be placed before measures in the SUMMARIZECOLUMNS() formula. In addition, columns and measures will be ordered in the order selected. If you would prefer a different order, unselect/reselect them in the correct order.
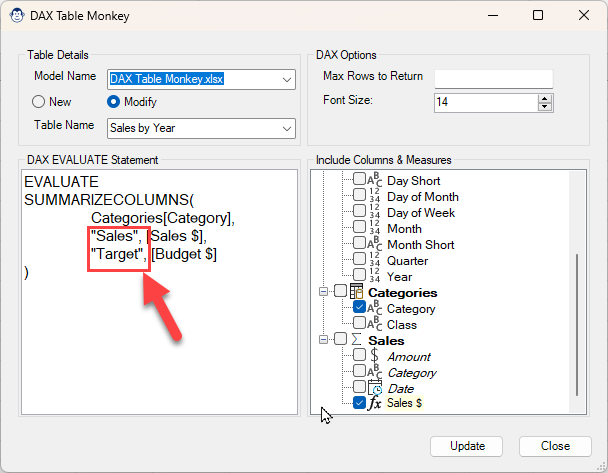
Another great feature of this Monkey is that you are able to edit the formula in this window. While we don’t provide any validation (that’s on you), it does allow you to update the names of the columns to be produced. When modifying measure names, make sure you rename the FIRST of the terms in the pair as shown in the image here.
Doing so returns the table with custom column names for the measures, as shown in the image to the right:
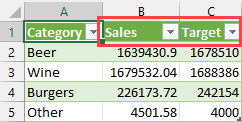
The DAX Table Monkey can be used to create new DAX Tables which read from your Data Models (or models hosted on powerbi.com), as well as modify existing DAX tables using our “no code” interface. While our monkey defaults to creating new DAX tables for you, the Modify button will be enabled if any DAX tables already exist in the current workbook. (In fact, the second table above was created by using the DAX Table Monkey to modify the original DAX table!)
If you would like to see the DAX Table Monkey in action, as well as some use cases for it, you can check out the recording of Ken’s “Creating Un-pivotable Charts” presentation for the Vancouver Modern Excel & Power BI user group on YouTube. It begins with an illustration of creating a DAX table manually, then shows how the DAX Table Monkey makes it so much easier.

Article Overview Monkey Tools offers several Excel feature improvements to build a better user experience. While the vast majority of these features are custom-built to
Article Overview The Connection Monkey is your one stop shop in order to connect to the various Excel workbooks or Power BI models that Monkey
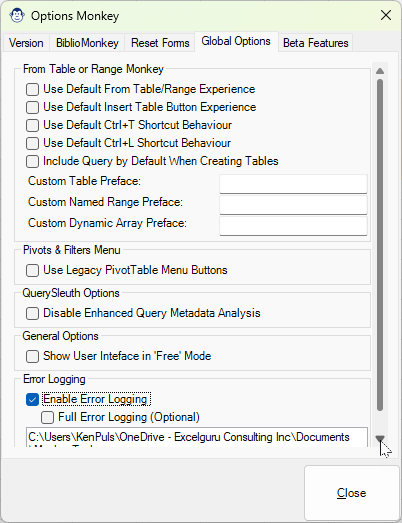
Article Overview What is an application with Options? Monkey Tools is no difference, and we have a specific Options Monkey to help you control them
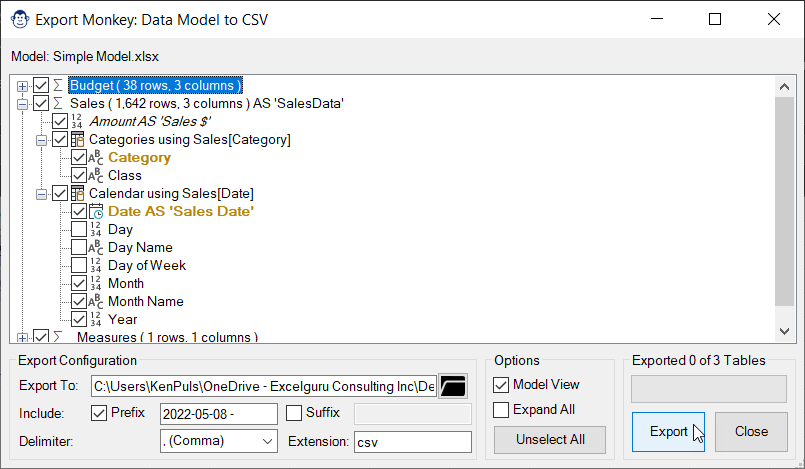
Coming Soon! Sorry, but this article isn’t quite ready yet. We promise that we’re working on it! In the mean time, we did feature this

Coming Soon! Sorry, but this article isn’t quite ready yet. We promise that we’re working on it! In the mean time – until we get